WTI Crude Oil: oil is getting slightly more expensive
18 September 2017, 09:02
| Scenario | |
|---|---|
| Timeframe | Intraday |
| Recommendation | BUY STOP |
| Entry Point | 50.75 |
| Take Profit | 51.50, 52.00 |
| Stop Loss | 50.00 |
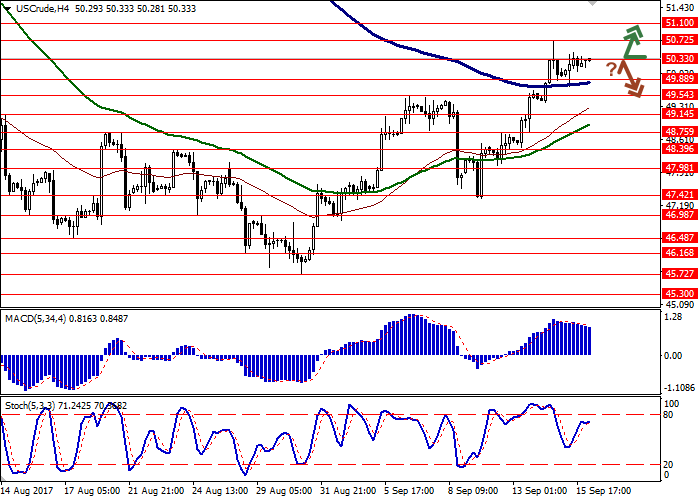
| Key Levels | 48.75, 49.14, 49.54, 49.88, 50.33, 50.72, 51.10 |
| Alternative scenario | |
|---|---|
| Recommendation | SELL STOP |
| Entry Point | 49.90 |
| Take Profit | 49.00 |
| Stop Loss | 50.70 |
| Key Levels | 48.75, 49.14, 49.54, 49.88, 50.33, 50.72, 51.10 |
Current trend
WTI oil prices showed moderate growth during trading on Friday, September 15, but failed to update local maximums formed the day before. Despite some corrective pressure on the instrument that occurred in the end of the previous week, market trends remain optimistic.
After the launch of US refineries the market is clearly showing the growth of demand. Moreover, OPEC has increased its outlook for oil demand in 2018 once again pointing out a positive effect from concluded agreements about the limitation of production. "Bullish" tendencies on Friday were also supported by the data of Baker Hughes report. Within the week that finished on September 15 the number of active oil platforms in the USA dropped from 756 to 749.
Support and resistance
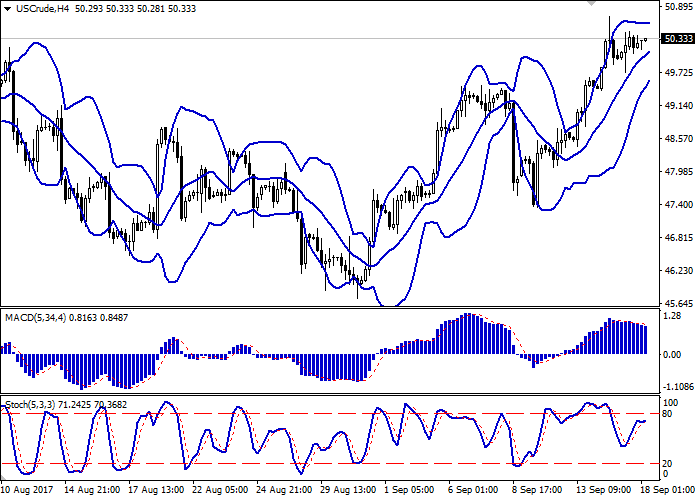
Bollinger Bands in H4 chart demonstrate stable increase. The price range is narrowing. MACD is going down preserving a slight sell signal (being located under the signal line). Stochastic is horizontal near the border with the overbought area and shows mixed dynamics.
Resistance levels: 50.33, 50.72, 51.10.
Support levels: 49.88, 49.54, 49.14, 48.75.


Trading tips
Long positions may be opened after breaking through the level of 50.72 with targets at 51.50, 52.00 and stop-loss at 50.00. The period of implementation is 2-3 days.
In case the price consolidates below 50.00, short positions may be opened with target at 49.00 and stop-loss at 50.70. The period of implementation is 2-3 days.
WTI oil prices showed moderate growth during trading on Friday, September 15, but failed to update local maximums formed the day before. Despite some corrective pressure on the instrument that occurred in the end of the previous week, market trends remain optimistic.
After the launch of US refineries the market is clearly showing the growth of demand. Moreover, OPEC has increased its outlook for oil demand in 2018 once again pointing out a positive effect from concluded agreements about the limitation of production. "Bullish" tendencies on Friday were also supported by the data of Baker Hughes report. Within the week that finished on September 15 the number of active oil platforms in the USA dropped from 756 to 749.
Support and resistance
Bollinger Bands in H4 chart demonstrate stable increase. The price range is narrowing. MACD is going down preserving a slight sell signal (being located under the signal line). Stochastic is horizontal near the border with the overbought area and shows mixed dynamics.
Resistance levels: 50.33, 50.72, 51.10.
Support levels: 49.88, 49.54, 49.14, 48.75.


Trading tips
Long positions may be opened after breaking through the level of 50.72 with targets at 51.50, 52.00 and stop-loss at 50.00. The period of implementation is 2-3 days.
In case the price consolidates below 50.00, short positions may be opened with target at 49.00 and stop-loss at 50.70. The period of implementation is 2-3 days.


No comments:
Write comments