
WTI Crude Oil: the growth slowed
08 September 2017, 11:11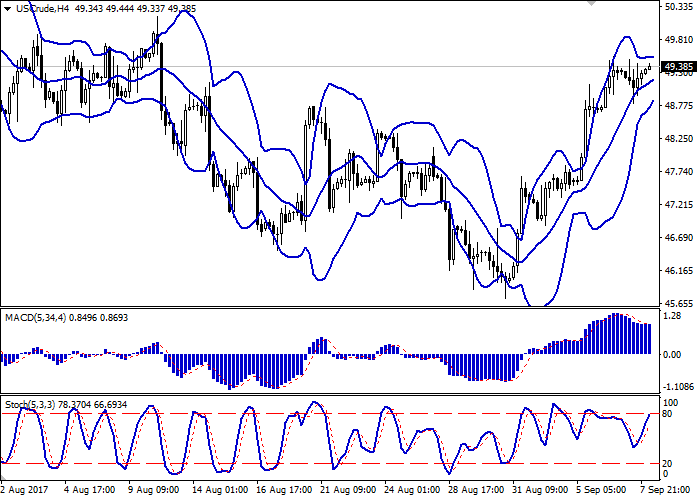
| Scenario | |
|---|---|
| Timeframe | Intraday |
| Recommendation | BUY STOP |
| Entry Point | 49.60 |
| Take Profit | 50.33, 50.50 |
| Stop Loss | 49.00 |
| Key Levels | 47.42, 47.98, 48.39, 48.75, 49.14, 49.54, 49.88, 50.33 |
| Alternative scenario | |
|---|---|
| Recommendation | SELL STOP |
| Entry Point | 48.90 |
| Take Profit | 48.00 |
| Stop Loss | 49.50 |
| Key Levels | 47.42, 47.98, 48.39, 48.75, 49.14, 49.54, 49.88, 50.33 |
Current trend
During trading session on Thursday, September, 7, oil prices were trading in different directions and closed in a red zone. After two sessions of steady growth the instrument return to decrease after EIA Crude Oil Stocks change publication, which showed that the oil recourses are growing again.
In a week US oil recourses increased by 4.580 million barrel, which was better than analysts expected — 4.022 million barrel. Last week the recourses went down by 5.392 million barrel.
In addition, oil prices were supported by OPEC oil export statistic data. In August the index reached the level of 25.19 million barrel, which is the lowest level since April.
Support and resistance
On the 4-hour chart Bollinger Bands are steady growing. The price range is narrowing, reflecting the appearance of controversial trading dynamics and the possibility of correction in the end of the current week. It’s better to use channel trading strategy.
MACD is slightly going down, keeping a weak sell signal (the histogram is below the signal line). The development of “bearish” signal is possible in the short term, if in the end of the week the instrument begins to grow.
Stochastic is growing, reaching the border of the overbought area. Like other indicators, Stochastic reflects the possibility of the downward correction development in the short or very short term.
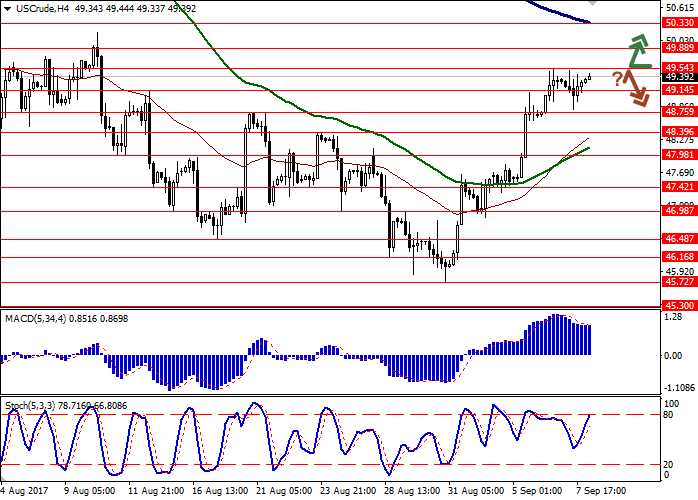
Resistance levels: 49.54, 49.88, 50.33.
Support levels: 49.14, 48.75, 48.39, 47.98, 47.42.

Trading tips
Long positions can be opened after the breakout the level of 49.54. Take profit is 50.33–50.50. Stop loss is 49.00. Implementation period: 2 days.
The reversal around current price levels can be the signal to open correctional short positions with the nearest target around 48.00. Stop loss is 49.50. Implementation period: 2–3 days.
During trading session on Thursday, September, 7, oil prices were trading in different directions and closed in a red zone. After two sessions of steady growth the instrument return to decrease after EIA Crude Oil Stocks change publication, which showed that the oil recourses are growing again.
In a week US oil recourses increased by 4.580 million barrel, which was better than analysts expected — 4.022 million barrel. Last week the recourses went down by 5.392 million barrel.
In addition, oil prices were supported by OPEC oil export statistic data. In August the index reached the level of 25.19 million barrel, which is the lowest level since April.
Support and resistance
On the 4-hour chart Bollinger Bands are steady growing. The price range is narrowing, reflecting the appearance of controversial trading dynamics and the possibility of correction in the end of the current week. It’s better to use channel trading strategy.
MACD is slightly going down, keeping a weak sell signal (the histogram is below the signal line). The development of “bearish” signal is possible in the short term, if in the end of the week the instrument begins to grow.
Stochastic is growing, reaching the border of the overbought area. Like other indicators, Stochastic reflects the possibility of the downward correction development in the short or very short term.
Resistance levels: 49.54, 49.88, 50.33.
Support levels: 49.14, 48.75, 48.39, 47.98, 47.42.
Trading tips
Long positions can be opened after the breakout the level of 49.54. Take profit is 50.33–50.50. Stop loss is 49.00. Implementation period: 2 days.
The reversal around current price levels can be the signal to open correctional short positions with the nearest target around 48.00. Stop loss is 49.50. Implementation period: 2–3 days.


No comments:
Write comments