
USD/JPY: wave analysis
21 September 2017, 09:16
| Scenario | |
|---|---|
| Timeframe | Weekly |
| Recommendation | BUY |
| Entry Point | 112.60 |
| Take Profit | 114.00, 114.50 |
| Stop Loss | 112.00 |
| Key Levels | 109.34, 109.94, 111.13, 114.00, 114.50 |
| Alternative scenario | |
|---|---|
| Recommendation | SELL STOP |
| Entry Point | 111.10 |
| Take Profit | 109.94, 109.34 |
| Stop Loss | 111.70 |
| Key Levels | 109.34, 109.94, 111.13, 114.00, 114.50 |
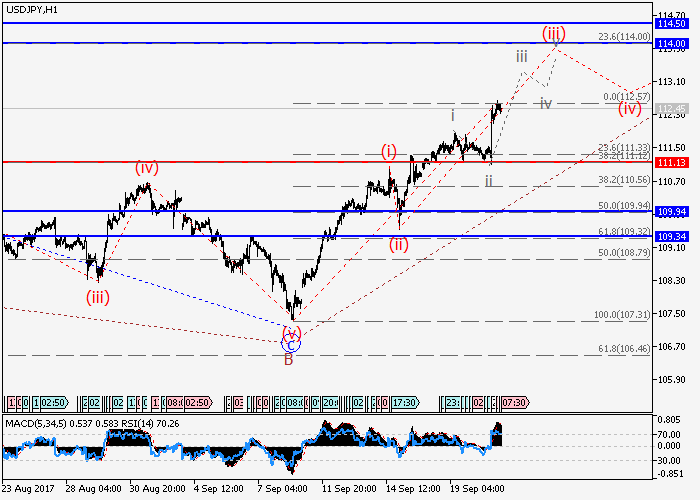
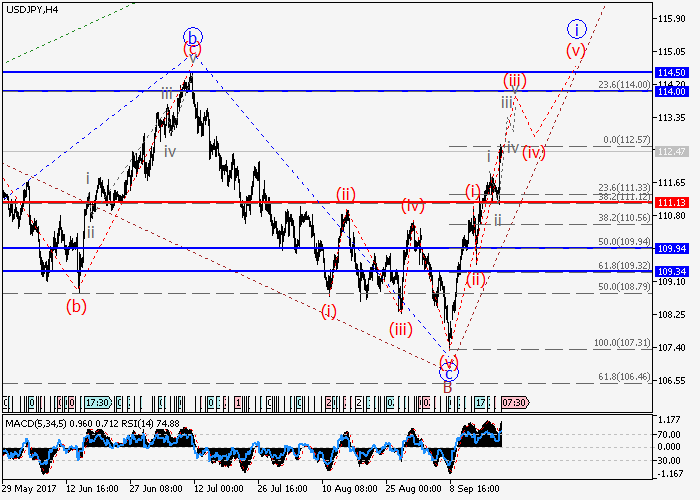
The upward trend is in force.
Presumably, the higher level C wave is forming, within the framework of which the first wave i is developing. At the moment, the third wave of the lower level (iii) of i is forming. If the assumption is true, it is logical to expect the pair to rise to 114.00-114.50. The level of 111.13 is critical for this scenario.
Main scenario
Buy during corrections, above the level of 111.13 with a target in the range of 114.00-114.50.
Alternative scenario
Breakdown of the level of 111.13 will allow the pair to continue the decline to the levels of 109.94-109.34.


No comments:
Write comments