USD/JPY: wave analysis
18 September 2017, 09:33
| Scenario | |
|---|---|
| Timeframe | Weekly |
| Recommendation | BUY |
| Entry Point | 111.31 |
| Take Profit | 112.30 |
| Stop Loss | 110.70 |
| Key Levels | 108.45, 109.55, 112.30 |
| Alternative scenario | |
|---|---|
| Recommendation | SELL STOP |
| Entry Point | 109.50 |
| Take Profit | 108.45 |
| Stop Loss | 110.10 |
| Key Levels | 108.45, 109.55, 112.30 |
The probability of growth remains.
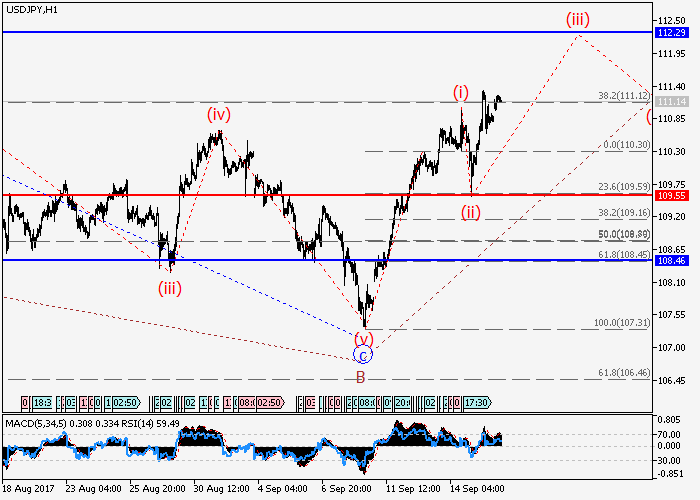
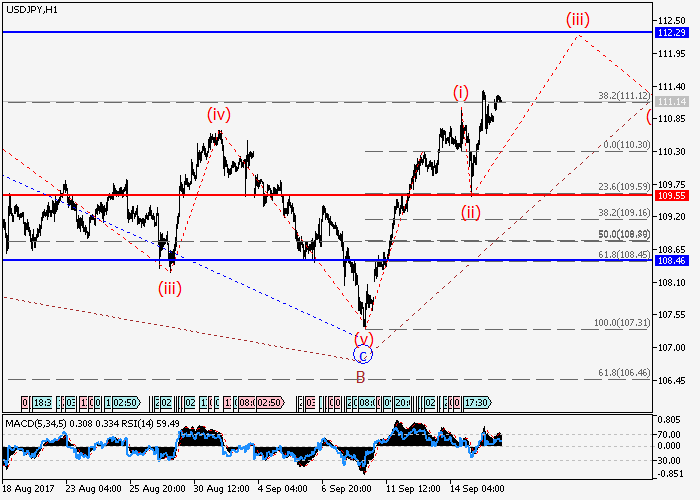
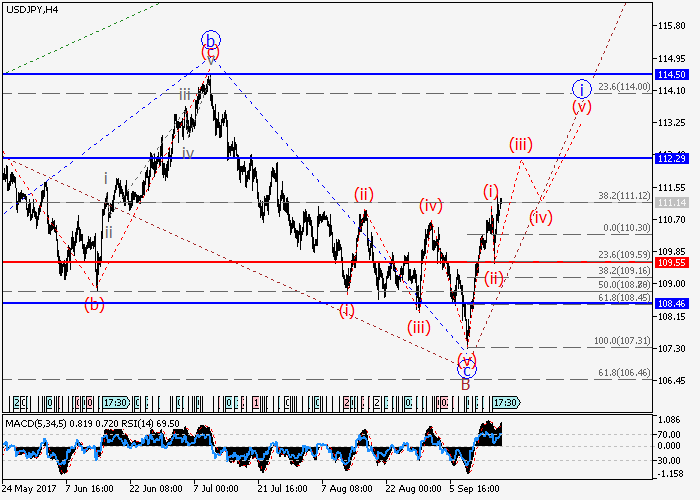
Presumably, the higher level C wave is still forming, as the first wave i is developing within it. At the moment, a third wave of lower level (iii) of i is being formed. If the assumption is true, it is logical to expect the growth of the pair to the level of 112.30. The level of 109.55 is critical for this scenario.


Main scenario
Buy a pair during corrections, above the level of 109.55 with a target of 112.30.
Alternative scenario
Breakdown of the level of 109.55 will allow the pair to continue the decline to the level of 108.45.
Presumably, the higher level C wave is still forming, as the first wave i is developing within it. At the moment, a third wave of lower level (iii) of i is being formed. If the assumption is true, it is logical to expect the growth of the pair to the level of 112.30. The level of 109.55 is critical for this scenario.


Main scenario
Buy a pair during corrections, above the level of 109.55 with a target of 112.30.
Alternative scenario
Breakdown of the level of 109.55 will allow the pair to continue the decline to the level of 108.45.


No comments:
Write comments