
USD/CHF: dollar is in correction
12 September 2017, 09:49
| Scenario | |
|---|---|
| Timeframe | Intraday |
| Recommendation | BUY STOP |
| Entry Point | 0.9580 |
| Take Profit | 0.9650 |
| Stop Loss | 0.9525 |
| Key Levels | 0.9418, 0.9474, 0.9496, 0.9525, 0.9541, 0.9575, 0.9600, 0.9650, 0.9677 |
| Alternative scenario | |
|---|---|
| Recommendation | SELL STOP |
| Entry Point | 0.9530 |
| Take Profit | 0.9474, 0.9418 |
| Stop Loss | 0.9570 |
| Key Levels | 0.9418, 0.9474, 0.9496, 0.9525, 0.9541, 0.9575, 0.9600, 0.9650, 0.9677 |
Current trend
During the trading session on Monday, September, 11, US dollar is growing against most of the main currencies, supported by the decrease of tense upon the North Korea and hurricane Irma situations. The USD/CHF pair stepped off the record lows since August, 2015, which it has reached last Friday. The correctional moods upon US currency are quite strong and can become the main drivers before the fundamental signal appears. On Wednesday, September, 13, the August production inflation data will be published in Switzerland and USA. On Thursday the National Bank of Switzerland and the Bank of England will release its interest rate decisions, and August consumption inflation data will be published in the USA.
Support and resistance
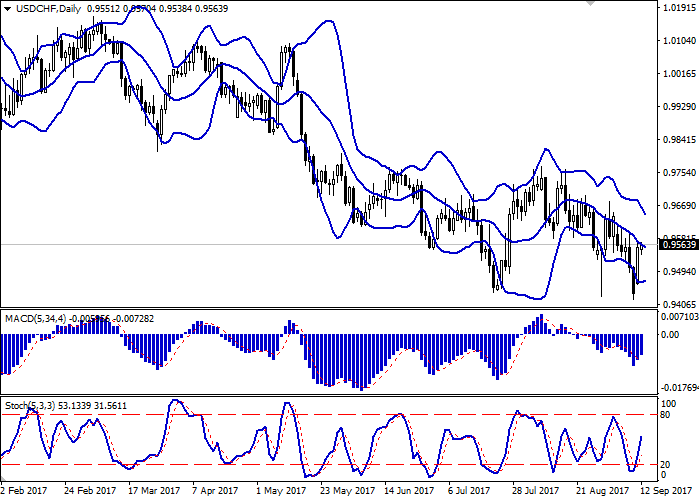
On the daily chart Bollinger Bands are falling. The price range is actively narrowing, reaction on the rapid growth of the instrument in the beginning of the week. The indicator don’t contradict with the further development of the downward trend in the middle time term, however, it’s better to wait until the short term upward correction ends.
MACD indicator is growing, keeping a buy signal (the histogram is above the signal line). Short positions in short or very short term can be opened.
Stochastic’s dynamics is the same, it’s growing to the border of the overbought area. It’s better to keep current long positions, but not to open new ones.
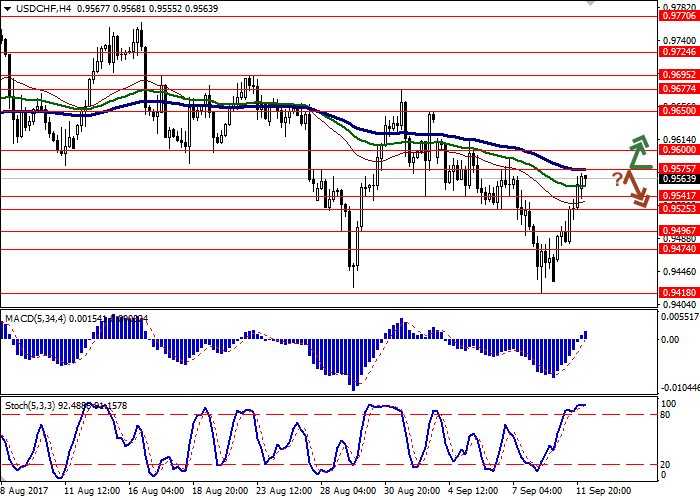
Resistance levels: 0.9575, 0.9600, 0.9650, 0.9677.
Support levels: 0.9541, 0.9525, 0.9496, 0.9474, 0.9418.
Trading tips
Long positions can be opened after the breakout the level of 0.9575. Take profit is 0.9650. Stop loss is 0.9525. Implementation period: 1-2 days.
The downward reversal around 0.9575 or 0.9600 can be the signal that “bearish” trend returns. The targets will be around 0.9474 or 0.9418. Stop loss is 0.9570. Implementation period: 2-3 days.
During the trading session on Monday, September, 11, US dollar is growing against most of the main currencies, supported by the decrease of tense upon the North Korea and hurricane Irma situations. The USD/CHF pair stepped off the record lows since August, 2015, which it has reached last Friday. The correctional moods upon US currency are quite strong and can become the main drivers before the fundamental signal appears. On Wednesday, September, 13, the August production inflation data will be published in Switzerland and USA. On Thursday the National Bank of Switzerland and the Bank of England will release its interest rate decisions, and August consumption inflation data will be published in the USA.
Support and resistance
On the daily chart Bollinger Bands are falling. The price range is actively narrowing, reaction on the rapid growth of the instrument in the beginning of the week. The indicator don’t contradict with the further development of the downward trend in the middle time term, however, it’s better to wait until the short term upward correction ends.
MACD indicator is growing, keeping a buy signal (the histogram is above the signal line). Short positions in short or very short term can be opened.
Stochastic’s dynamics is the same, it’s growing to the border of the overbought area. It’s better to keep current long positions, but not to open new ones.
Resistance levels: 0.9575, 0.9600, 0.9650, 0.9677.
Support levels: 0.9541, 0.9525, 0.9496, 0.9474, 0.9418.
Trading tips
Long positions can be opened after the breakout the level of 0.9575. Take profit is 0.9650. Stop loss is 0.9525. Implementation period: 1-2 days.
The downward reversal around 0.9575 or 0.9600 can be the signal that “bearish” trend returns. The targets will be around 0.9474 or 0.9418. Stop loss is 0.9570. Implementation period: 2-3 days.


No comments:
Write comments