
NZD/USD: the pair is showing mixed dynamics
19 September 2017, 09:42
| Scenario | |
|---|---|
| Timeframe | Intraday |
| Recommendation | BUY STOP |
| Entry Point | 0.7300 |
| Take Profit | 0.7342, 0.7375 |
| Stop Loss | 0.7260 |
| Key Levels | 0.7200, 0.7222, 0.7246, 0.7261, 0.7297, 0.7319, 0.7342 |
| Alternative scenario | |
|---|---|
| Recommendation | SELL STOP |
| Entry Point | 0.7240 |
| Take Profit | 0.7181 |
| Stop Loss | 0.7280 |
| Key Levels | 0.7200, 0.7222, 0.7246, 0.7261, 0.7297, 0.7319, 0.7342 |
Current trend
NZD showed growth against US dollar during trading on Monday, September 18, but failed to consolidate on gained positions (local maximums since August 10). The growth of USD was supported by expectations of the Fed's minutes that may support "bullish" tendencies in USD.
During the morning session on September 19 the pair is trading in the upward trend despite the release of weak data on consumer sentiment index. According to Westpac, in Q3 2017 the index dropped from 113.4 to 112.4 points which was a little worse than expected by analysts. With the opening of the US session investors will switch their attention to US statistics on the dynamics of housing construction in August.
Support and resistance
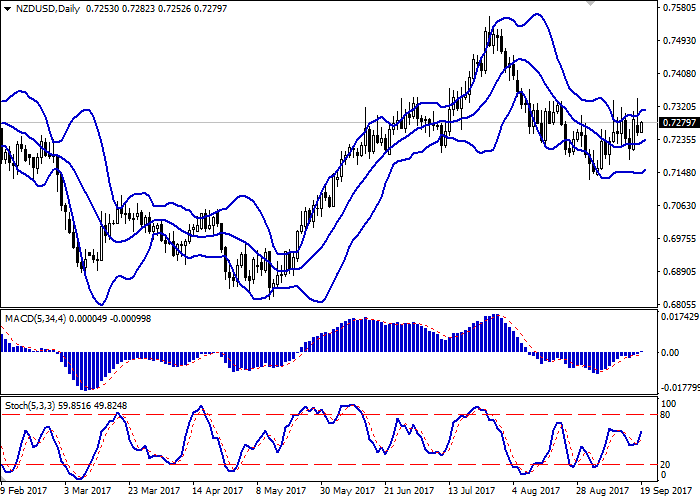
Bollinger Bands in D1 chart demonstrate unstable increase. The price range is narrowing. MACD indicator is growing preserving a stable buy signal (the histogram is above the signal line). Stochastic is growing, approaching the border of the overbought zone.
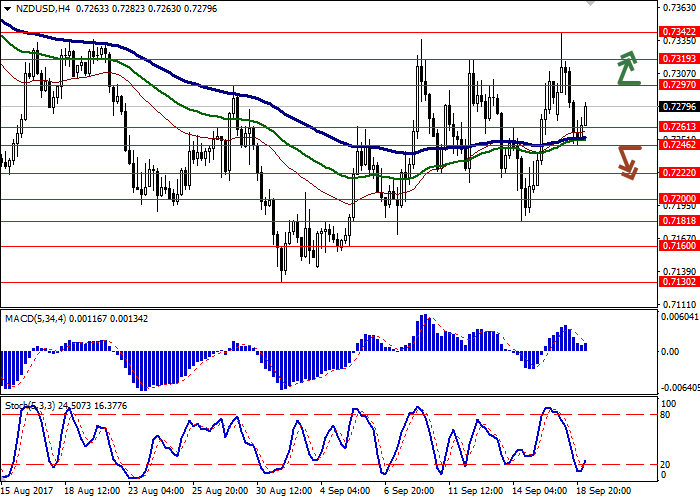
Resistance levels: 0.7297, 0.7319, 0.7342.
Support levels: 0.7261, 0.7246, 0.7222, 0.7200.
Trading tips
Long positions may be opened after breaking through the level of 0.7297 with targets at 0.7342, 0.7375 and stop-loss at 0.7260. The period of implementation is 2 days.
Breaking down the level of 0.7246 may be a signal to opening short positions with target at 0.7181 and stop-loss at 0.7280. The period of implementation is 2-3 days.
NZD showed growth against US dollar during trading on Monday, September 18, but failed to consolidate on gained positions (local maximums since August 10). The growth of USD was supported by expectations of the Fed's minutes that may support "bullish" tendencies in USD.
During the morning session on September 19 the pair is trading in the upward trend despite the release of weak data on consumer sentiment index. According to Westpac, in Q3 2017 the index dropped from 113.4 to 112.4 points which was a little worse than expected by analysts. With the opening of the US session investors will switch their attention to US statistics on the dynamics of housing construction in August.
Support and resistance
Bollinger Bands in D1 chart demonstrate unstable increase. The price range is narrowing. MACD indicator is growing preserving a stable buy signal (the histogram is above the signal line). Stochastic is growing, approaching the border of the overbought zone.
Resistance levels: 0.7297, 0.7319, 0.7342.
Support levels: 0.7261, 0.7246, 0.7222, 0.7200.
Trading tips
Long positions may be opened after breaking through the level of 0.7297 with targets at 0.7342, 0.7375 and stop-loss at 0.7260. The period of implementation is 2 days.
Breaking down the level of 0.7246 may be a signal to opening short positions with target at 0.7181 and stop-loss at 0.7280. The period of implementation is 2-3 days.


No comments:
Write comments