EUR/USD: general review
18 September 2017, 13:07
| Scenario | |
|---|---|
| Timeframe | Intraday |
| Recommendation | BUY |
| Entry Point | 1.1965 |
| Take Profit | 1.2025 |
| Stop Loss | 1.1920 |
| Key Levels | 1.1800, 1.1855, 1.1920, 1.1980, 1.2025, 1.2090 |
| Alternative scenario | |
|---|---|
| Recommendation | SELL STOP |
| Entry Point | 1.1910 |
| Take Profit | 1.1855 |
| Stop Loss | 1.1950 |
| Key Levels | 1.1800, 1.1855, 1.1920, 1.1980, 1.2025, 1.2090 |
Current trend
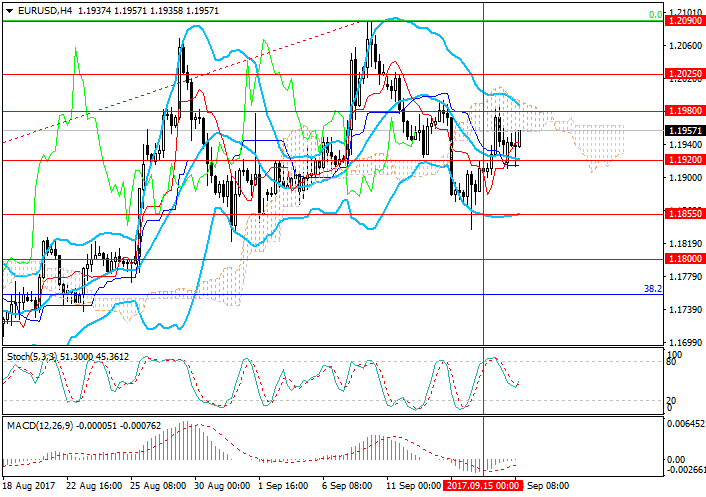
On Friday after the release of negative data on retail sales (-0.2%) and industrial output volume (-0.9%) in the USA the price of the pair rose to 1.1985 but then was corrected and is currently trading near the middle line of Bollinger Bands at 1.1940. Currently investors are cautious waiting for the results of the Fed's meeting on Wednesday. Therefore the pair may remain within the range of 1.1920-1.1980 in the near future.
In view of the upcoming meeting of the Fed European statistics is considered less important. Here attention should be paid to the release of final August inflation data from Eurozone. The values of CPI and its basic variant are still far from target levels and make up 1.5% and 1.3% respectively. Business sentiment index by ZEW is due tomorrow. The indicator may grow from 10,0 to 12.5 points for Germany and from 29.3 to 32.4 points for Eurozone. In this case the price will continue to grow to the upper border of the range.
Support and resistance
Technically the pair has tested the middle line of Bollinger Bands around the level of 1.1920 and may soon reach 1.1980. However, serious growth to the levels of 1.2025 and 1.2090 may happen only after the price consolidates above 1.1980. Breaking down the level of 1.1920 (middle line of Bollinger Bands) will open the way for further decrease to the lower line of Bollinger Bands at 1.1855 and further to 1.1800. Technical indicators show growth: MACD histogram is about to move to the positive zone and to form a buy signal, and Stochastic is reversing upwards.
Support levels: 1.1920 1.1855, 1.1800.
Resistance levels: 1.1980, 1.2025, 1.2090.

Trading tips
Long positions may be opened from the current price with targets at 1.1980, 1.2025 and stop-loss at 1.1920.1.1920.
Short position may be opened in case the price reverses around the level of 1.1980 or breaks down the level of 1.1920 with target at 1.1855 and stop-losses at 1.2010 and 1.1950.
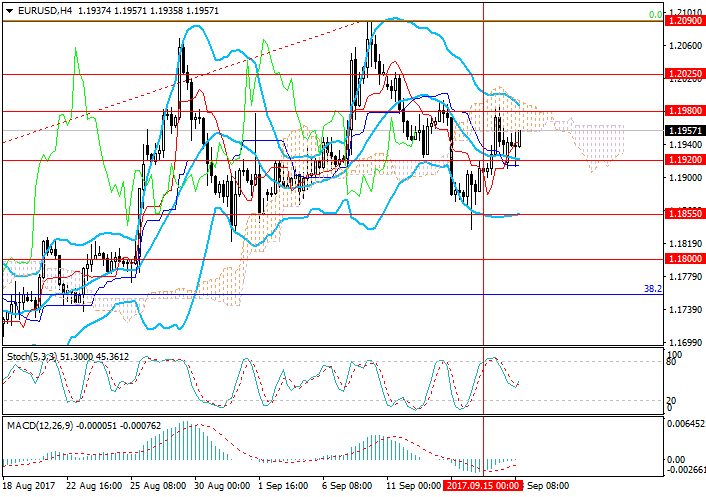
On Friday after the release of negative data on retail sales (-0.2%) and industrial output volume (-0.9%) in the USA the price of the pair rose to 1.1985 but then was corrected and is currently trading near the middle line of Bollinger Bands at 1.1940. Currently investors are cautious waiting for the results of the Fed's meeting on Wednesday. Therefore the pair may remain within the range of 1.1920-1.1980 in the near future.
In view of the upcoming meeting of the Fed European statistics is considered less important. Here attention should be paid to the release of final August inflation data from Eurozone. The values of CPI and its basic variant are still far from target levels and make up 1.5% and 1.3% respectively. Business sentiment index by ZEW is due tomorrow. The indicator may grow from 10,0 to 12.5 points for Germany and from 29.3 to 32.4 points for Eurozone. In this case the price will continue to grow to the upper border of the range.
Support and resistance
Technically the pair has tested the middle line of Bollinger Bands around the level of 1.1920 and may soon reach 1.1980. However, serious growth to the levels of 1.2025 and 1.2090 may happen only after the price consolidates above 1.1980. Breaking down the level of 1.1920 (middle line of Bollinger Bands) will open the way for further decrease to the lower line of Bollinger Bands at 1.1855 and further to 1.1800. Technical indicators show growth: MACD histogram is about to move to the positive zone and to form a buy signal, and Stochastic is reversing upwards.
Support levels: 1.1920 1.1855, 1.1800.
Resistance levels: 1.1980, 1.2025, 1.2090.

Trading tips
Long positions may be opened from the current price with targets at 1.1980, 1.2025 and stop-loss at 1.1920.1.1920.
Short position may be opened in case the price reverses around the level of 1.1980 or breaks down the level of 1.1920 with target at 1.1855 and stop-losses at 1.2010 and 1.1950.


No comments:
Write comments