Brent Crude Oil: technical analysis
15 September 2017, 12:25
| Scenario | |
|---|---|
| Timeframe | Intraday |
| Recommendation | BUY |
| Entry Point | 55.23 |
| Take Profit | 55.75 |
| Stop Loss | 54.85 |
| Key Levels | 52.00, 52.50, 53.00, 53.50, 54.10, 54.50, 55.00, 55.75, 56.40 |
| Alternative scenario | |
|---|---|
| Recommendation | SELL STOP |
| Entry Point | 54.50 |
| Take Profit | 53.50 |
| Stop Loss | 54.85 |
| Key Levels | 52.00, 52.50, 53.00, 53.50, 54.10, 54.50, 55.00, 55.75, 56.40 |
Brent, D1
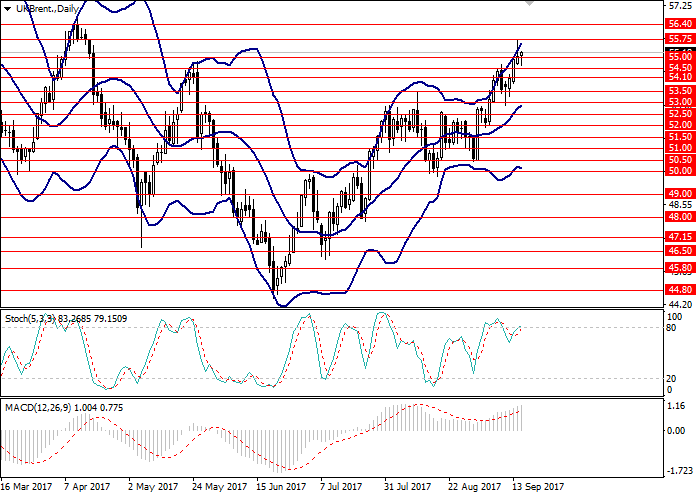
On the D1 chart the instrument broke through the strong resistance level of 55.00 and continued to grow along the upper border of Bollinger Bands. The price range is widened which may indicate possible continuation of the upward trend. MACD histogram is in the positive zone, the signal line is crossing the body of the histogram from below, giving a signal for opening buy orders. Stochastic is in the neutral zone near the border with the overbought zone. In case the border is broken from below, the price may reverse.

Brent, H4
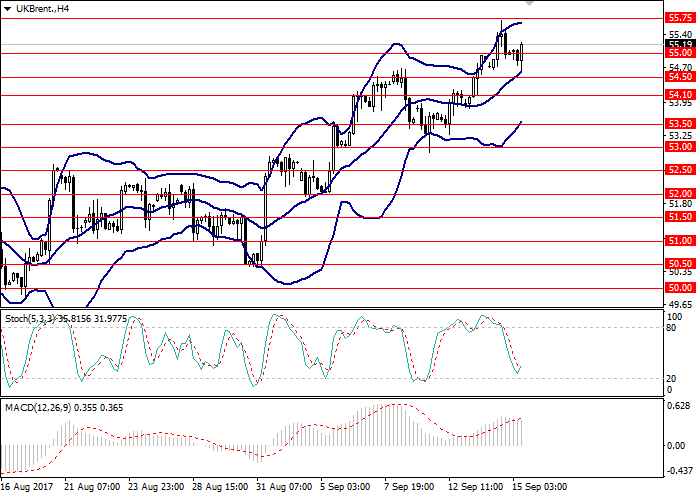
On the H4 chart the instrument is showing lateral movement within the narrow range marked by the upper and middle lines of Bollinger Bands. MACD histogram is in the positive area keeping a signal for the opening of long positions. Stochastic is moving towards the border between the neutral and oversold zones. In case the border is crossed from below it will be a signal for opening buy orders.

Key levels
Support levels: 55.00, 54.50, 54.10, 53.50, 53.00, 52.50, 52.00.
Resistance levels: 55.75, 56.40.
Trading tips
The opening of long positions seems preferable from the key price level with target at 55.75 and stop-loss at 54.85. The period of implementation is 1-2 days.
Short positions may be opened from the level of 54.50 with target at 53.50 and stop-loss at 54.85. The period of implementation is 2-3 days.
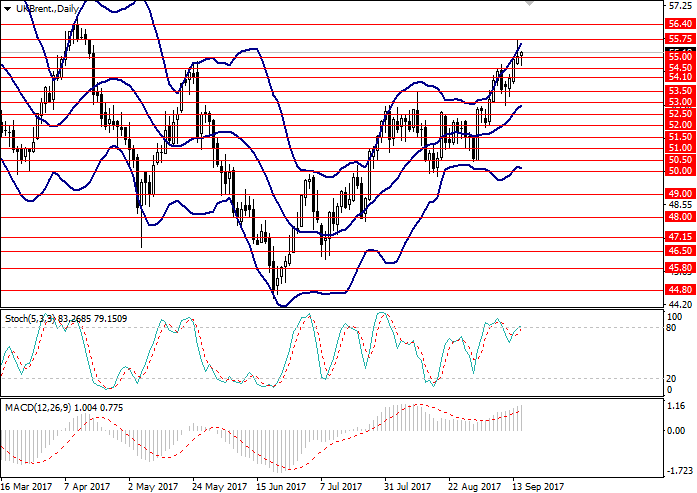
On the D1 chart the instrument broke through the strong resistance level of 55.00 and continued to grow along the upper border of Bollinger Bands. The price range is widened which may indicate possible continuation of the upward trend. MACD histogram is in the positive zone, the signal line is crossing the body of the histogram from below, giving a signal for opening buy orders. Stochastic is in the neutral zone near the border with the overbought zone. In case the border is broken from below, the price may reverse.

Brent, H4
On the H4 chart the instrument is showing lateral movement within the narrow range marked by the upper and middle lines of Bollinger Bands. MACD histogram is in the positive area keeping a signal for the opening of long positions. Stochastic is moving towards the border between the neutral and oversold zones. In case the border is crossed from below it will be a signal for opening buy orders.

Key levels
Support levels: 55.00, 54.50, 54.10, 53.50, 53.00, 52.50, 52.00.
Resistance levels: 55.75, 56.40.
Trading tips
The opening of long positions seems preferable from the key price level with target at 55.75 and stop-loss at 54.85. The period of implementation is 1-2 days.
Short positions may be opened from the level of 54.50 with target at 53.50 and stop-loss at 54.85. The period of implementation is 2-3 days.


No comments:
Write comments