AUD/USD: the pair is showing mixed dynamics
15 September 2017, 09:51
| Scenario | |
|---|---|
| Timeframe | Intraday |
| Recommendation | BUY STOP |
| Entry Point | 0.8020 |
| Take Profit | 0.8080, 0.8100 |
| Stop Loss | 0.7970 |
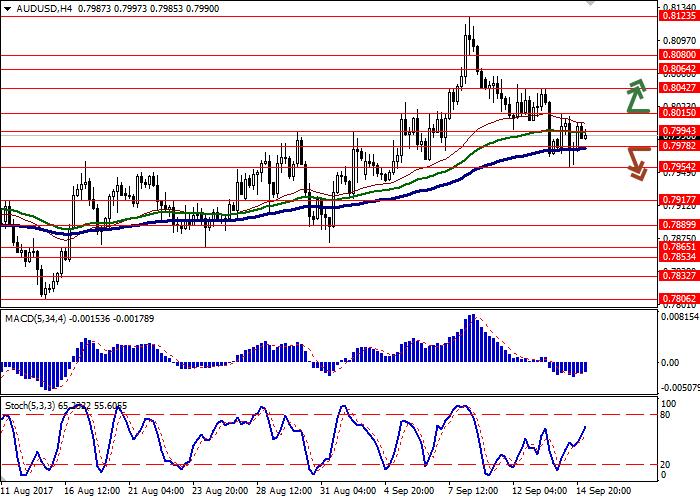
| Key Levels | 0.7865, 0.7889, 0.7917, 0.7954, 0.7978, 0.7994, 0.8015, 0.8042, 0.8064, 0.8080 |
| Alternative scenario | |
|---|---|
| Recommendation | SELL STOP |
| Entry Point | 0.7970, 0.7950 |
| Take Profit | 0.7889 |
| Stop Loss | 0.8020 |
| Key Levels | 0.7865, 0.7889, 0.7917, 0.7954, 0.7978, 0.7994, 0.8015, 0.8042, 0.8064, 0.8080 |
Current trend
Australian dollar moderately grew against USD as a result of trading on Thursday, September 14, moving away from local minimums since September 5. The reason for the growth of AUD was positive data on the Australian labor market in August. The level of employment in August grew by 54.2K workplaces against 29.2K last month. Analysts expected to see a decrease to 15.0K.
More serious growth was prevented by quite stable US currency that receive support from strong consumer inflation data on Thursday. In August CPI grew by 1.9% YoY after growth by 1.7% in July. Experts expected growth to make up 1.8% YoY.
On Friday, September 15, investors expected the release of the data on retail sales and industrial output in the USA at 14:30 and 15:00 (GMT+2) respectively. If this block of data also appears to be better than expected, USD may finish the week with growth.
Support and resistance
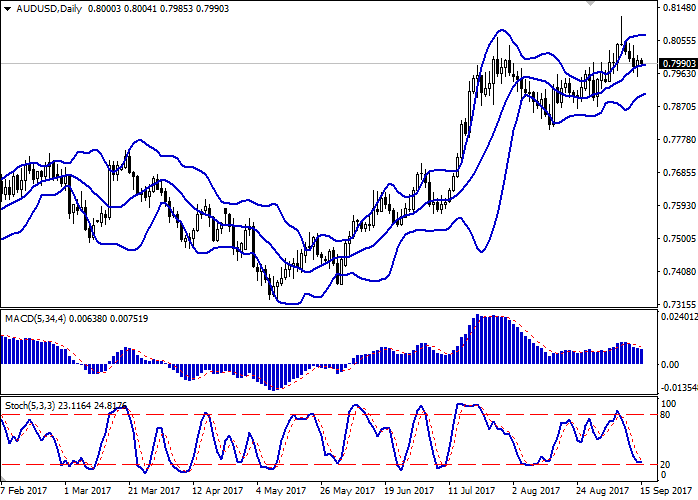
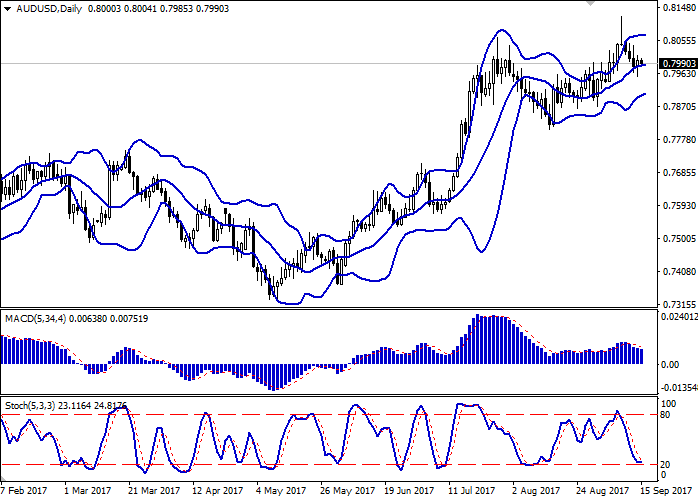
On the D1 chart Bollinger Bands have reversed horizontally. The price range remains practically unchanged. MACD is going down preserving a moderate sell signal (being located under the signal line). Stochastic has approached the border of the oversold area and reversed horizontally reacting to growth attempts on Thursday.
Resistance levels: 0.7994, 0.8015, 0.8042, 0.8064, 0.8080.
Support levels: 0.7978, 0.7954, 0.7917, 0.7889, 0.7865.


Trading tips
Long positions may be opened after breaking through the level of 0.8015 with target at 0.8080, 0.8100 and stop-loss at 0.7970. The period of implementation is 2-3 days.
A breakdown of the level of 0.7978 or 0.7954 may be a signal for further sales with target at 0.7889 and stop-loss at 0.8020. The period of implementation is 2-3 days.
Australian dollar moderately grew against USD as a result of trading on Thursday, September 14, moving away from local minimums since September 5. The reason for the growth of AUD was positive data on the Australian labor market in August. The level of employment in August grew by 54.2K workplaces against 29.2K last month. Analysts expected to see a decrease to 15.0K.
More serious growth was prevented by quite stable US currency that receive support from strong consumer inflation data on Thursday. In August CPI grew by 1.9% YoY after growth by 1.7% in July. Experts expected growth to make up 1.8% YoY.
On Friday, September 15, investors expected the release of the data on retail sales and industrial output in the USA at 14:30 and 15:00 (GMT+2) respectively. If this block of data also appears to be better than expected, USD may finish the week with growth.
Support and resistance
On the D1 chart Bollinger Bands have reversed horizontally. The price range remains practically unchanged. MACD is going down preserving a moderate sell signal (being located under the signal line). Stochastic has approached the border of the oversold area and reversed horizontally reacting to growth attempts on Thursday.
Resistance levels: 0.7994, 0.8015, 0.8042, 0.8064, 0.8080.
Support levels: 0.7978, 0.7954, 0.7917, 0.7889, 0.7865.


Trading tips
Long positions may be opened after breaking through the level of 0.8015 with target at 0.8080, 0.8100 and stop-loss at 0.7970. The period of implementation is 2-3 days.
A breakdown of the level of 0.7978 or 0.7954 may be a signal for further sales with target at 0.7889 and stop-loss at 0.8020. The period of implementation is 2-3 days.


No comments:
Write comments