
XAU/USD: gold is ready for a local reversal
14 July 2022, 11:37
| Scenario | |
|---|---|
| Timeframe | Weekly |
| Recommendation | BUY STOP |
| Entry Point | 1745.5 |
| Take Profit | 1786.0 |
| Stop Loss | 1720.0 |
| Key Levels | 1685.0, 1707.0, 1745.0, 1786.0 |
| Alternative scenario | |
|---|---|
| Recommendation | SELL STOP |
| Entry Point | 1706.5 |
| Take Profit | 1685.0 |
| Stop Loss | 1720.0 |
| Key Levels | 1685.0, 1707.0, 1745.0, 1786.0 |
Current trend
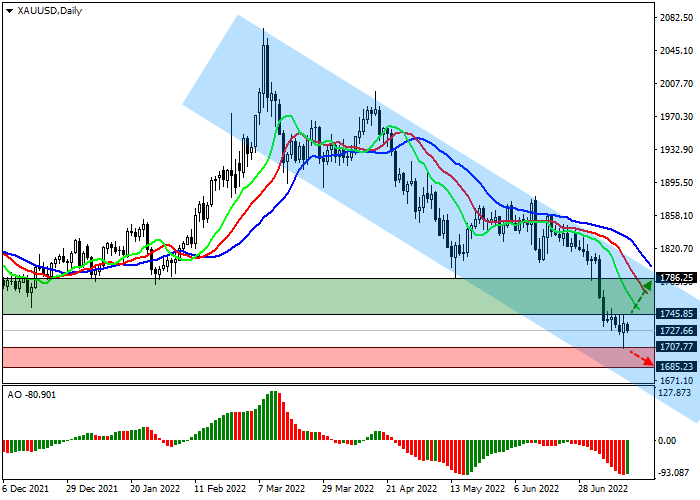
The XAU/USD pair is correcting within a downtrend at 1727.00. The trading instrument is declining in response to the growth of the US dollar, which continues to renew multi-year highs.
There are only three most liquid equivalent assets in the global economy: the US dollar, oil, and gold. When one of them rises sharply, the other two always fall, which is what is happening now: the oil price has fallen below 100.00, and gold quotes are approaching 1700.00. This situation cannot last long: the issue of the US currency causes an increase in inflation, which has already exceeded 9.0%, which means that the purchasing power of the population has decreased again, and this will lead to a drop in demand for the dollar, which will provoke an increase in oil and gold.
Primary signs of this process can be seen in the latest data from the Commodity Futures Trading Commission (CFTC). According to its recent report, in all major categories, there is a preponderance of contracts in favor of sellers. For example, swap dealers had 217,444K sell positions against 90,707K buy positions. At the same time, the weekly dynamics of change suggest that the "bears" are starting to get rid of their contracts actively and are gradually turning into "bulls": for example, over the past week, the number of sell positions has decreased by 15.748K, while the buy positions, on the contrary, increased by 1,849K.
Support and resistance
On the daily chart of the asset, the price is moving within the global downward channel. Technical indicators maintain a sell signal, not excluding a slight correction: fast EMAs on the Alligator indicator are below the signal line, and the AO oscillator histogram has formed the first rising bar in the sell zone.
Resistance levels: 1745.0, 1786.0.
Support levels: 1707.0, 1685.0.

Trading tips
Long positions may be opened after a reversal, growth, and consolidation of the price above 1745.0 with the target at 1786.0. Stop loss is 1720.0. Implementation period: 7 days or more.
Short positions may be opened after the price drops and consolidates below 1707.0 with the target at 1685.0. Stop loss is 1720.0.


No comments:
Write comments