
USD/JPY: dollar hits record highs
14 July 2022, 11:38

| Scenario | |
|---|---|
| Timeframe | Intraday |
| Recommendation | BUY |
| Entry Point | 138.75 |
| Take Profit | 140.50 |
| Stop Loss | 137.50 |
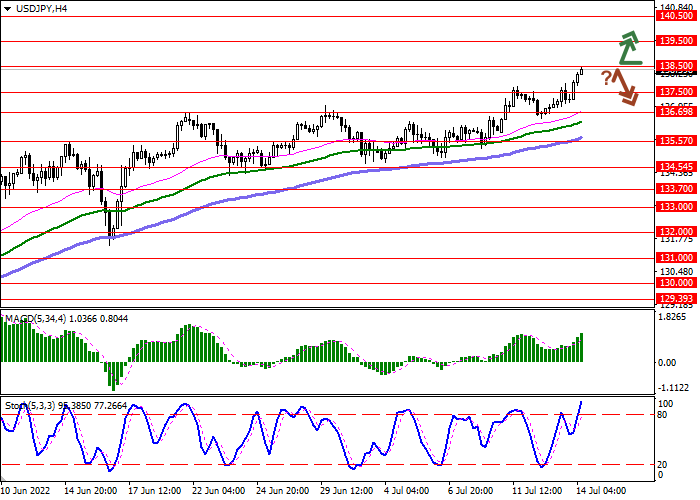
| Key Levels | 134.54, 135.57, 136.69, 137.50, 138.50, 139.50, 140.50. |
| Alternative scenario | |
|---|---|
| Recommendation | SELL STOP |
| Entry Point | 137.45 |
| Take Profit | 135.57 |
| Stop Loss | 138.50 |
| Key Levels | 134.54, 135.57, 136.69, 137.50, 138.50, 139.50, 140.50. |
Current trend
The US currency is showing active growth, renewing record highs and testing the level of 138.35 for a breakout, having received support from expectations of further tightening of monetary policy by the US Federal Reserve.
Yesterday's macroeconomic statistics from the US reflected a sharp increase in inflationary pressure in June from 8.6% to 9.1%, which was a new high in 40 years. Despite the actions of the US regulator, inflation continues to increase, reacting to the difficult situation in the energy market and supply disruptions. The Fed is forced to continue tightening monetary policy, despite the growing risks of a recession in the national economy. It is assumed that on July 27 the regulator will raise the interest rate by at least 75 basis points, but after the release of inflation data, an increase by 100 basis points is quite likely, especially since the Bank of Canada made a similar decision the day before.
In turn, the yen today came under pressure from macroeconomic statistics: Industrial Production fell by 7.5% MoM and 4.7% YoY, which was significantly worse than the expected contraction of 7.2% MoM and 2.8% YoY.
Support and resistance
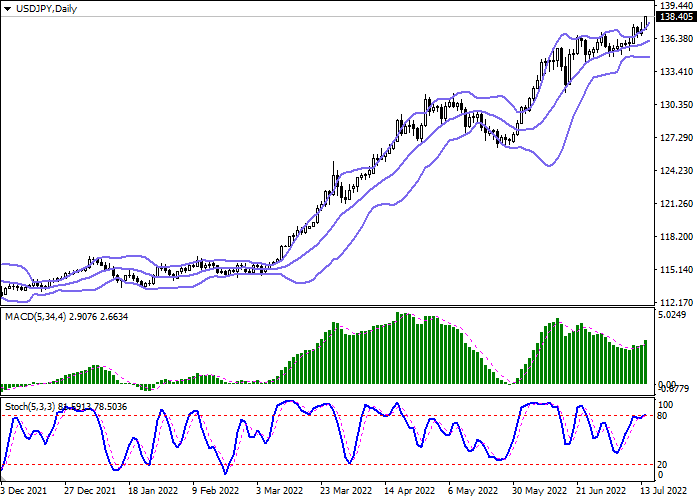
Bollinger Bands in D1 chart show moderate growth. The price range is expanding from above but it fails to conform to the surge of "bullish" activity at the moment. MACD indicator is growing, while preserving a rather stable buy signal (located above the signal line). Stochastic retains upward direction but is located near its highs, which indicates the risks of overbought USD in the ultra-short term.
Resistance levels: 138.50, 139.50, 140.50.
Support levels: 137.50, 136.69, 135.57, 134.54.
Trading tips
Long positions can be opened after a breakout of 138.50 with the target of 140.50. Stop-loss — 137.50. Implementation time: 1-2 days.
A rebound from 138.50 as from resistance, followed by a breakdown of 137.50 may become a signal for opening of new short positions with the target at 135.57. Stop-loss — 138.50.


No comments:
Write comments