
USD/CAD: the pair is trading ambiguously
13 July 2022, 11:25

| Scenario | |
|---|---|
| Timeframe | Intraday |
| Recommendation | BUY STOP |
| Entry Point | 1.3055 |
| Take Profit | 1.3150 |
| Stop Loss | 1.3000 |
| Key Levels | 1.2850, 1.2900, 1.2950, 1.3000, 1.3050, 1.3100, 1.3150, 1.3200 |
| Alternative scenario | |
|---|---|
| Recommendation | SELL STOP |
| Entry Point | 1.2945 |
| Take Profit | 1.2850 |
| Stop Loss | 1.3000 |
| Key Levels | 1.2850, 1.2900, 1.2950, 1.3000, 1.3050, 1.3100, 1.3150, 1.3200 |
Current trend
During the Asian session, the USD/CAD pair is moderately declining and testing 1.3000 for a breakdown, correcting after a two-day increase, but the "bears" are still acting indecisively.
Activity on the trading instrument remains quite low, as investors prefer to wait for today's release of key US macroeconomic statistics on consumer price dynamics, which, according to forecasts, will rise to 8.8%, which will put additional pressure on the US Federal Reserve's decision to tighten monetary policy further. Several analysts do not rule out an increase in the indicator to the psychological mark of 9.0%, which may force the regulator to raise the rate by 75 basis points at once. Also, the economic review of the Beige book department and the monthly report on the state of the US budget for June will be published on Wednesday.
Today, the Bank of Canada will announce its decision on monetary policy: analysts' forecast suggests an active increase in interest rates by 75 basis points to 2.25%, but the regulator may decide to act at a more relaxed pace since the June report on the labor market was somewhat disappointing experts: the employment rate fell sharply by 43.2K, while analysts expected it to grow by 23.5K, and the unemployment rate fell from 5.1% to 4.9%.
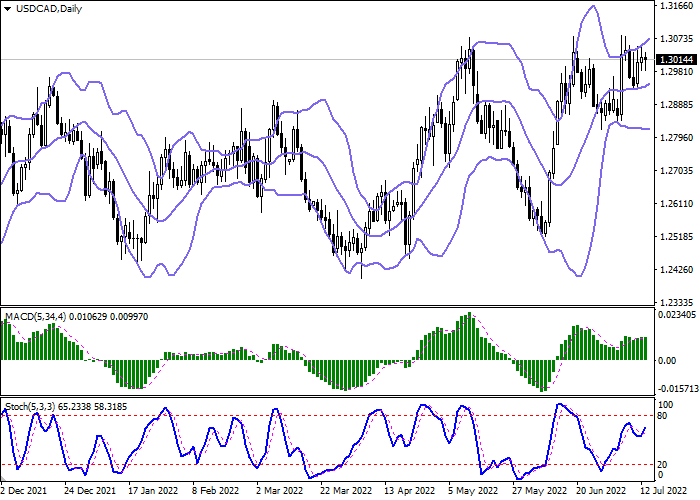
Support and resistance
On the daily chart, Bollinger bands are growing moderately. The price range is expanding from above, letting the "bulls" renew local highs. The MACD indicator is growing, keeping a poor buy signal (the histogram is above the signal line). After a short decline at the end of the last trading week, Stochastic is again trying to reverse upwards, located near its highs.
Resistance levels: 1.3050, 1.3100, 1.3150, 1.3200.
Support levels: 1.3000, 1.2950, 1.2900, 1.2850.
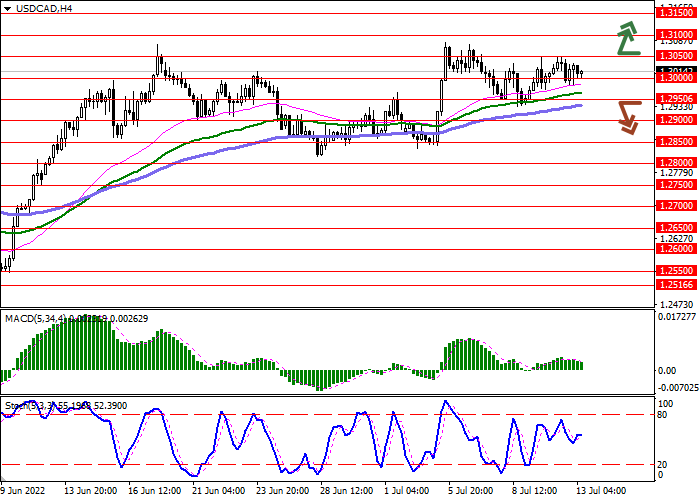
Trading tips
Long positions may be opened after the breakout of the level 1.3050 with the target at 1.3150. Stop loss – 1.3000. Implementation period: 2–3 days.
Short positions may be opened after the breakdown of 1.2950 with the target at 1.2850. Stop loss – 1.3000.


No comments:
Write comments