EUR/USD: the euro is held near the parity level with the US dollar
13 July 2022, 11:24

| Scenario | |
|---|---|
| Timeframe | Intraday |
| Recommendation | SELL STOP |
| Entry Point | 0.9990 |
| Take Profit | 0.9900 |
| Stop Loss | 1.0050 |
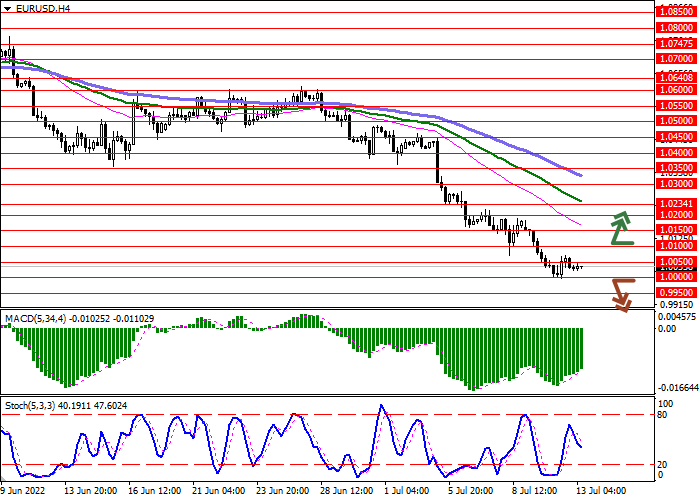
| Key Levels | 0.9900, 0.9950, 1.0000, 1.0050, 1.0100, 1.0150, 1.0200 |
| Alternative scenario | |
|---|---|
| Recommendation | BUY STOP |
| Entry Point | 1.0110 |
| Take Profit | 1.0200 |
| Stop Loss | 1.0050 |
| Key Levels | 0.9900, 0.9950, 1.0000, 1.0050, 1.0100, 1.0150, 1.0200 |
Current trend
The European currency shows multidirectional trading dynamics, consolidating near the key level of 1.0000, which has not yet been actively tested. The day before, the instrument also traded near the parity level and even tried to fall to the level of 0.9990 for some time; however, the "bulls" quickly regained the lost positions. The euro is certainly receiving strong technical support near this psychological level, but the pressure on the single currency only intensifies as the region's economic outlook deteriorates. The last time the euro traded at parity against the US dollar was in December 2002.
Yesterday's macroeconomic statistics put additional pressure on the positions of the single currency, intensifying talks about a possible recession in the European economy: ZEW Survey on Economic Sentiment fell sharply in July from –28.0 to –51.1 points, while analysts expected a decline to only –32.8 points. In turn, ZEW Survey on Current Situation in Germany over the same period fell from –27.6 to –45.8 points, while the forecast was –34.5 points, and the Economic Sentiment index fell from –28.0 to –53.8 points, which also turned out to be significantly worse than market forecasts at the level of –38.3 points.
Today, investors are focused on statistics on the dynamics of consumer prices in Germany in June, as well as May data on the dynamics of industrial production in the eurozone.
Support and resistance
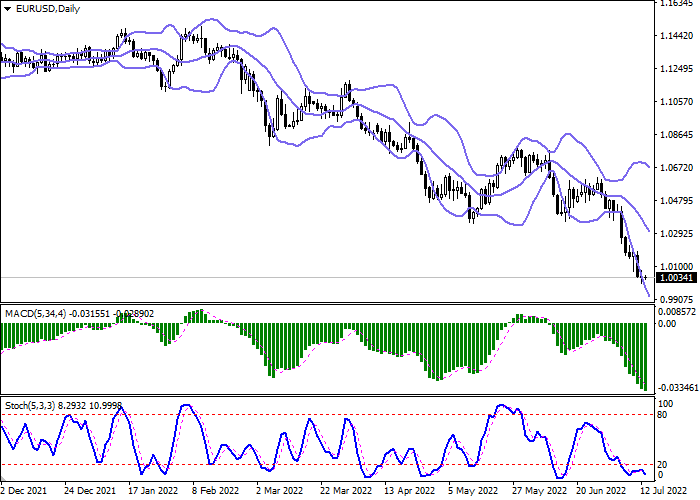
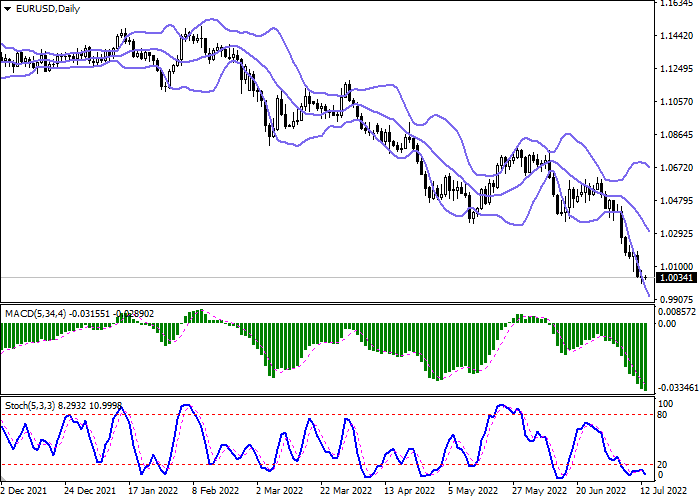
Bollinger Bands in D1 chart demonstrate active decrease. The price range is expanding, making way to new record lows for the "bears". MACD is going down preserving a stable sell signal (located below the signal line). Stochastic retains downward direction but is located in close proximity to its lows, which indicates the risks of oversold EUR in the ultra-short term.
Resistance levels: 1.0050, 1.0100, 1.0150, 1.0200.
Support levels: 1.0000, 0.9950, 0.9900.


Trading tips
Short positions may be opened after a breakdown of 1.0000 with the target at 0.9900. Stop-loss — 1.0050. Implementation time: 2-3 days.
The return of the "bullish" trend with the breakout of 1.0100 may become a signal for new purchases with the target of 1.0200. Stop-loss — 1.0050.


No comments:
Write comments