
NZD/USD: technical analysis
02 November 2021, 11:37

| Scenario | |
|---|---|
| Timeframe | Weekly |
| Recommendation | SELL STOP |
| Entry Point | 0.7135 |
| Take Profit | 0.6925 |
| Stop Loss | 0.7200 |
| Key Levels | 0.6925, 0.7135, 0.7216, 0.7311 |
| Alternative scenario | |
|---|---|
| Recommendation | BUY STOP |
| Entry Point | 0.7216 |
| Take Profit | 0.7311 |
| Stop Loss | 0.7150 |
| Key Levels | 0.6925, 0.7135, 0.7216, 0.7311 |
Current trend
NZD/USD is correcting against the background of USD consolidation and is near 0.7162.
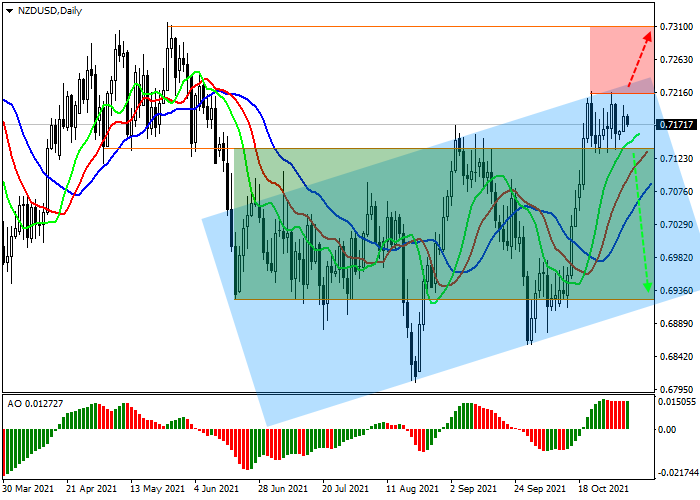
NZD/USD, D1
On the daily chart, the instrument continues to trade within the broad ascending channel with the borders of 0.7230 and 0.6930, being near the resistance line, which coincides with the solid annual level of 0.7230. The global signal from technical indicators remains "bullish", but begins to weaken.
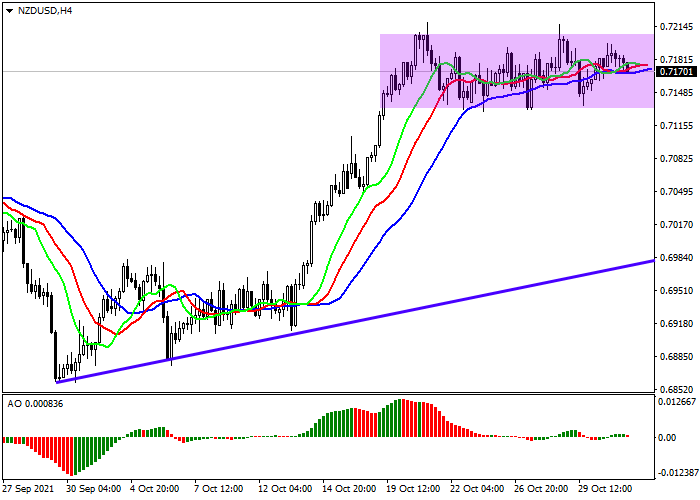
NZD/USD, H4
On the 4-hour chart, the correction is developing within the local sideways channel with the boundaries of 0.7200 and 0.7130, the exit from which will probably take place downward in the direction of the local support line at 0.7010. This is indicated by the long-term presence of the price in the overbought zone. Technical indicators have almost reversed downwards and are preparing to give a clear signal: the fluctuation range of the Alligator indicator EMAs is actively narrowing and the histogram of the AO oscillator is approaching the transition level.
Support and resistance
Resistance levels: 0.7216, 0.7311.
Support levels: 0.7135, 0.6925.
Trading tips
If the asset reverses and declines and the price consolidates below the local support level at 0.7135, short positions can be opened with the target at 0.6925. Stop-loss – 0.7200. Implementation time: 7 days and more.
If the price continues growing and consolidates above the local resistance level of 0.7216, long positions with target at 0.7311 will be relevant. Stop-loss — 0.7150.


No comments:
Write comments