
EUR/USD: markets awaiting decisions from the US Fed and the ECB
02 November 2021, 11:30
| Scenario | |
|---|---|
| Timeframe | Weekly |
| Recommendation | SELL STOP |
| Entry Point | 1.1528 |
| Take Profit | 1.1400 |
| Stop Loss | 1.1600 |
| Key Levels | 1.1400, 1.1528, 1.1688, 1.1885 |
| Alternative scenario | |
|---|---|
| Recommendation | BUY STOP |
| Entry Point | 1.1688 |
| Take Profit | 1.1885 |
| Stop Loss | 1.1600 |
| Key Levels | 1.1400, 1.1528, 1.1688, 1.1885 |
Current trend
Taking advantage of the temporary weakness in the US dollar, the EUR/USD pair corrects within a sideways trend, trading around 1.1605.
There are few factors for the continuation of positive dynamics, as the macroeconomic indicators of the leading EU economies continue to deteriorate: the volume of retail sales in Germany in September fell by 2.5% after an increase of 1.2% was recorded in August. The annual indicator also entered the negative zone, decreasing by 0.9%. Today, after the publication of data on unemployment in the euro area, the chairman of the European Central Bank (ECB) Christine Lagarde is scheduled to speak, during which investors expect to hear the specifics of the measures taken by the authorities regarding the future tightening of monetary policy, which has recently caused concern among bidders.
USD Index again dropped below the psychological level of 94.000. Yesterday, tomorrow's meeting of the US Federal Reserve, there is nervousness in the market. Opinions that the regulator will begin to reduce the quantitative easing (QE) program already at this meeting have recently increased significantly. Moreover, analysts expect that the department will completely roll back QE by mid-2022. If this does happen, the dollar, supported by investors' hopes for lower inflation, will receive a positive momentum for the movement.
Support and resistance
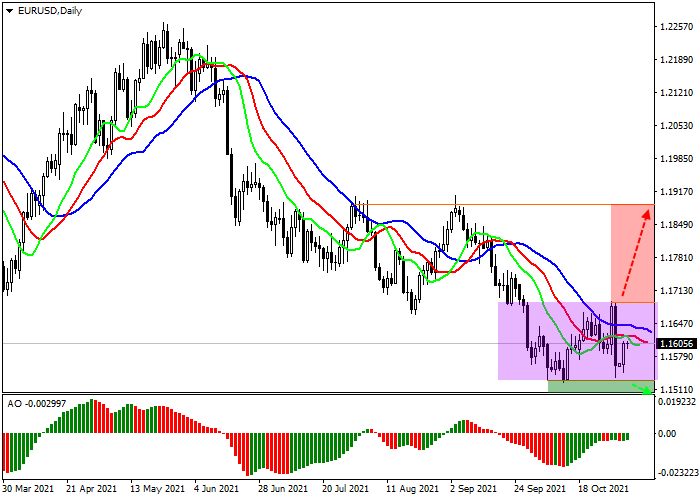
On the global chart, the price moves within the local sideways channel, preparing to decline. Technical indicators keep a sell signal: indicator Alligator's EMA fluctuations range began to expand, and the AO oscillator histogram is in the sell zone.
Resistance levels: 1.1688, 1.1885.
Support levels: 1.1528, 1.1400.

Trading tips
After decline or consolidation below the local support of 1.1528, sell positions with the target at 1.1400 are relevant. Stop loss – 1.1600. Implementation period: 7 days or more.
After local growth or consolidation above the local resistance of 1.1688, buy positions with the target around 1.1885 are relevant. Stop loss – 1.1600.


No comments:
Write comments