
USD/CAD: investors await the publication of data from Canada
21 April 2021, 12:43
| Scenario | |
|---|---|
| Timeframe | Intraday |
| Recommendation | BUY STOP |
| Entry Point | 1.2655 |
| Take Profit | 1.2746 |
| Stop Loss | 1.2600 |
| Key Levels | 1.2471, 1.2500, 1.2554, 1.2600, 1.2650, 1.2700, 1.2746 |
| Alternative scenario | |
|---|---|
| Recommendation | SELL |
| Entry Point | 1.2590 |
| Take Profit | 1.2500 |
| Stop Loss | 1.2650 |
| Key Levels | 1.2471, 1.2500, 1.2554, 1.2600, 1.2650, 1.2700, 1.2746 |
Current trend
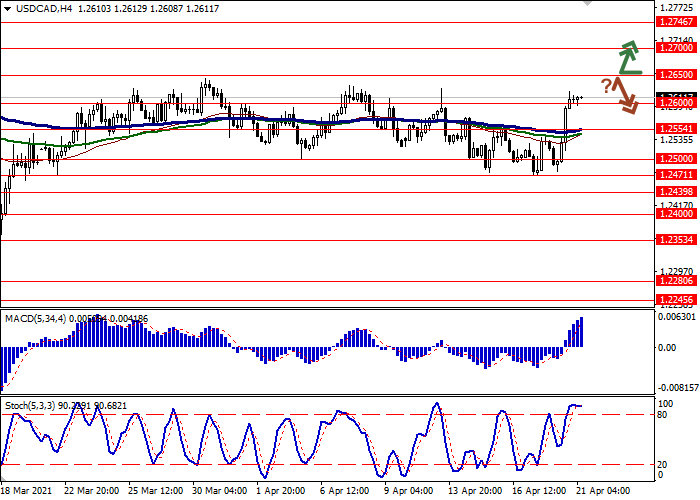
Today, during the Asian session, the USD/CAD pair is showing flat dynamics, consolidating near the level of 1.2600 after active growth yesterday. There are still few fundamental reasons for the growth of the American currency, and the yield on Treasury bonds remains low and varies in a narrow range.
On Wednesday, investors are focused on the Bank of Canada meeting on interest rates with an accompanying press conference. As before, no changes in the vector of monetary policy are expected, however, the market hopes to hear the Central Bank's comments on the current economic situation in the country. Before the meeting of the regulator, key statistics on consumer inflation in Canada for March will be published. Analysts' forecasts suggest that the core CPI from the Central Bank for March will accelerate from 1.2% YoY to 1.4% YoY.
Support and resistance
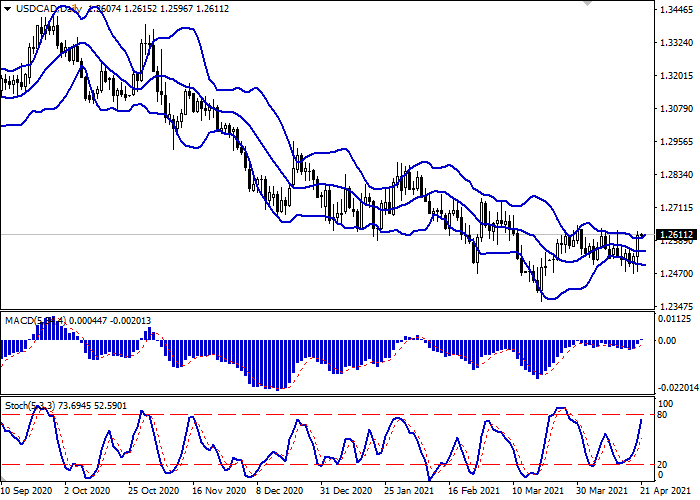
On the daily chart, Bollinger bands are moving flat. The price range expands from above but not as fast as the “bullish” sentiments develop. The MACD indicator also reversed towards growth, having formed a strong buy signal (the histogram is above the signal line), and is trying to consolidate above the zero line. Stochastic maintains a strong upward trend but is rapidly approaching its highs, indicating that USD may become overbought in the ultra-short term.
It is better to keep current long positions until the signals from technical indicators are clarified.
Resistance levels: 1.2650, 1.2700, 1.2746.
Support levels: 1.2600, 1.2554, 1.2500, 1.2471.

Trading tips
Long positions may be opened after the breakout of 1.2650 with the target at 1.2746. Stop loss – 1.2600. Implementation period: 1–2 days.
Short positions may be opened after the rebound from 1.2650 and the breakdown of 1.2600 with a target at 1.2500. Stop loss – 1.2650.


No comments:
Write comments