
Brent Crude Oil: oil prices are rising moderately
04 February 2019, 08:59
| Scenario | |
|---|---|
| Timeframe | Intraday |
| Recommendation | BUY STOP |
| Entry Point | 63.10 |
| Take Profit | 64.42, 65.00 |
| Stop Loss | 62.00 |
| Key Levels | 60.50, 61.00, 61.50, 62.30, 63.04, 63.82, 64.42, 65.00 |
| Alternative scenario | |
|---|---|
| Recommendation | SELL STOP |
| Entry Point | 62.25, 61.95 |
| Take Profit | 61.00, 60.50, 60.30 |
| Stop Loss | 63.00, 63.20 |
| Key Levels | 60.50, 61.00, 61.50, 62.30, 63.04, 63.82, 64.42, 65.00 |
Current trend
On Friday, oil prices grew, renewing the maximum since January 21.
US Baker Hughes Oil Rig Count report actively supported the instrument. According to the data received, over the week, the number of working rigs dropped sharply from 862 to 847 units, which did not coincide with market expectations. The previous time the report reflected the growth from 852 to 862 units.
Additional support for the course has a tense situation in Venezuela. Yesterday, in an interview with CBS television, US President Donald Trump did not rule out the possibility of sending the US military to Venezuela.
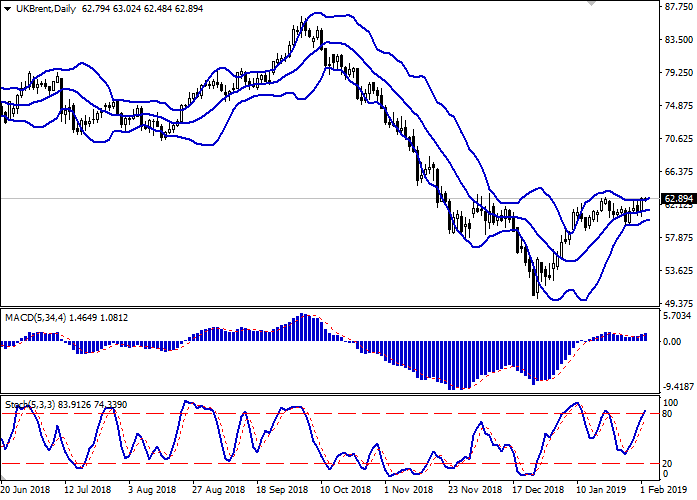
Support and resistance
On the daily chart, Bollinger bands are moving flat. The price range is slightly widening but not as fast as the "bullish" activity is developing. The MACD indicator is growing, keeping a poor buy signal (the histogram is above the signal line). Stochastic maintains an upward direction but is nearing its highs, which indicates that the instrument can become overbought in the super-short term.
It is better to keep current long positions until the market situation becomes clearer.
Resistance levels: 63.04, 63.82, 64.42, 65.00.
Support levels: 62.30, 61.50, 61.00, 60.50.
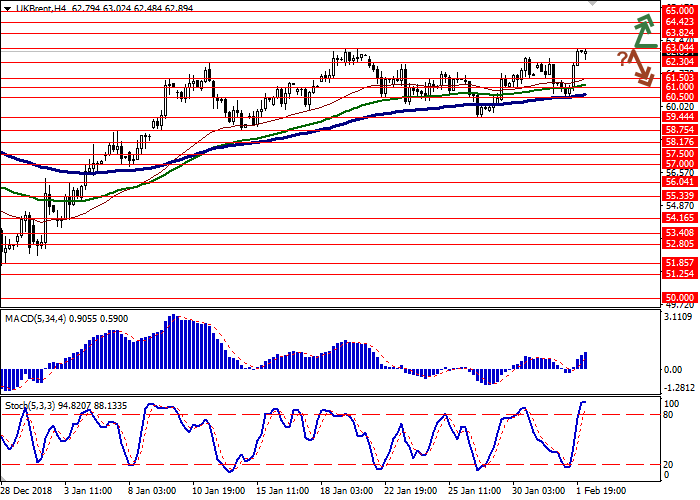
Trading tips
Long positions can be opened after the breakout of the level of 63.04 with the target at 64.42 or 65.00. Stop loss is 62.00.
Short positions can be opened after the rebound from the level of 63.04 and the breakdown of the levels of 62.30–62.00 with the targets at 61.00 or 60.50–60.30. Stop loss is 63.00–63.20.
Implementation period: 2–3 days.
On Friday, oil prices grew, renewing the maximum since January 21.
US Baker Hughes Oil Rig Count report actively supported the instrument. According to the data received, over the week, the number of working rigs dropped sharply from 862 to 847 units, which did not coincide with market expectations. The previous time the report reflected the growth from 852 to 862 units.
Additional support for the course has a tense situation in Venezuela. Yesterday, in an interview with CBS television, US President Donald Trump did not rule out the possibility of sending the US military to Venezuela.
Support and resistance
On the daily chart, Bollinger bands are moving flat. The price range is slightly widening but not as fast as the "bullish" activity is developing. The MACD indicator is growing, keeping a poor buy signal (the histogram is above the signal line). Stochastic maintains an upward direction but is nearing its highs, which indicates that the instrument can become overbought in the super-short term.
It is better to keep current long positions until the market situation becomes clearer.
Resistance levels: 63.04, 63.82, 64.42, 65.00.
Support levels: 62.30, 61.50, 61.00, 60.50.
Trading tips
Long positions can be opened after the breakout of the level of 63.04 with the target at 64.42 or 65.00. Stop loss is 62.00.
Short positions can be opened after the rebound from the level of 63.04 and the breakdown of the levels of 62.30–62.00 with the targets at 61.00 or 60.50–60.30. Stop loss is 63.00–63.20.
Implementation period: 2–3 days.


No comments:
Write comments