
AUD/USD: general analysis
04 February 2019, 09:27
| Scenario | |
|---|---|
| Timeframe | Intraday |
| Recommendation | BUY LIMIT |
| Entry Point | 0.7180 |
| Take Profit | 0.7355 |
| Stop Loss | 0.7135 |
| Key Levels | 0.6940, 0.7011, 0.7081, 0.7192, 0.7241, 0.7295, 0.7358, 0.7396 |
| Alternative scenario | |
|---|---|
| Recommendation | SELL STOP |
| Entry Point | 0.7130 |
| Take Profit | 0.7080, 0.7060 |
| Stop Loss | 0.7160 |
| Key Levels | 0.6940, 0.7011, 0.7081, 0.7192, 0.7241, 0.7295, 0.7358, 0.7396 |
Current trend
Last week, the AUD/USD pair strengthened due to the "dovish" statement by the Fed Chairman regarding monetary policy.
On Wednesday, the head of the American regulator, Jerome Powell, said that raising interest rates is almost impossible in the near future for a number of strong technical reasons, including poor inflationary pressure and difficult trade US-China negotiations.
However, the instrument could not break the strong psychological level of 0.7300, having significantly lost in price on Friday. AUD is under pressure of strong data on the American labor market and negative statistics of the Australian commodity market. In addition, a reduction in the growth rate of Chinese industry affected the price negatively.
Tomorrow, market participants will follow the meeting of the RBA on monetary policy due at 06:30 (GMT+2). The parameters of monetary policy are expected to stay unchanged. Given the weak Australian macroeconomic statistics of recent weeks and the lack of certainty in trade negotiations, the head of the RBA will make very careful comments that will further reduce the pair.
Support and resistance
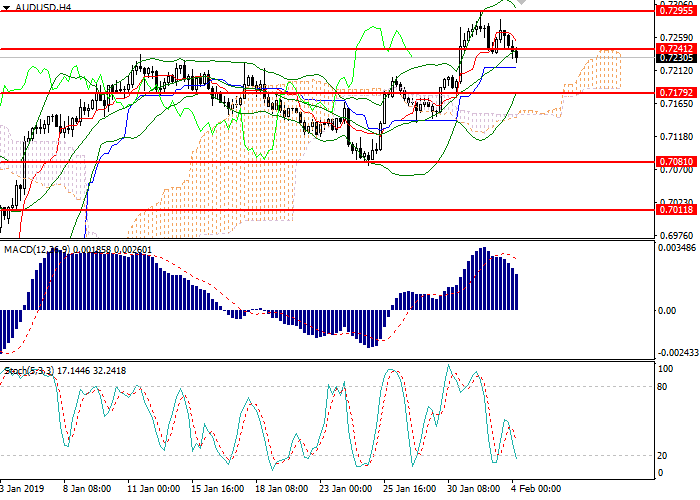
On the 4-hour chart, the instrument consolidated below the moving average line of Bollinger band. The indicator is directed upwards, and the price range decreased, indicating a change in the downward trend during the day. The histogram is in the positive zone, the buy signal is still relevant. Stochastic entered the oversold area; a strong buy signal can be formed in the coming hours.
Resistance levels: 0.7241, 0.7295, 0.7358, 0.7396.
Support levels: 0.7192, 0.7081, 0.7011, 0.6940.
Trading tips
Long positions can be opened from 0.7180 with the target at 0.7355 and stop loss 0.7135.
Short positions should be opened below 0.7135 with the targets at 0.7080–0.7060 and stop loss 0.7160.
Implementation period: 1–2 days.
Last week, the AUD/USD pair strengthened due to the "dovish" statement by the Fed Chairman regarding monetary policy.
On Wednesday, the head of the American regulator, Jerome Powell, said that raising interest rates is almost impossible in the near future for a number of strong technical reasons, including poor inflationary pressure and difficult trade US-China negotiations.
However, the instrument could not break the strong psychological level of 0.7300, having significantly lost in price on Friday. AUD is under pressure of strong data on the American labor market and negative statistics of the Australian commodity market. In addition, a reduction in the growth rate of Chinese industry affected the price negatively.
Tomorrow, market participants will follow the meeting of the RBA on monetary policy due at 06:30 (GMT+2). The parameters of monetary policy are expected to stay unchanged. Given the weak Australian macroeconomic statistics of recent weeks and the lack of certainty in trade negotiations, the head of the RBA will make very careful comments that will further reduce the pair.
Support and resistance
On the 4-hour chart, the instrument consolidated below the moving average line of Bollinger band. The indicator is directed upwards, and the price range decreased, indicating a change in the downward trend during the day. The histogram is in the positive zone, the buy signal is still relevant. Stochastic entered the oversold area; a strong buy signal can be formed in the coming hours.
Resistance levels: 0.7241, 0.7295, 0.7358, 0.7396.
Support levels: 0.7192, 0.7081, 0.7011, 0.6940.
Trading tips
Long positions can be opened from 0.7180 with the target at 0.7355 and stop loss 0.7135.
Short positions should be opened below 0.7135 with the targets at 0.7080–0.7060 and stop loss 0.7160.
Implementation period: 1–2 days.


No comments:
Write comments