AddToAny

AddToAny

Theme images by MichaelJay. Powered by Blogger.

USD/JPY: the epidemiological situation in Japan is rapidly deteriorating 28 July 2022, 11:47

  USD/JPY: the epidemiological situation in Japan is rapidly deteriorating 28 July 2022, 11:47 Scenario Timeframe Weekly Reco...

Jul 20, 2022

EUR/USD: the European currency received a positive impetus 20 July 2022, 10:50


Scenario
Timeframe Weekly
Recommendation BUY STOP
Entry Point 1.0350
Take Profit 1.0624
Stop Loss 1.0250
Key Levels 1.0000, 1.0185, 1.0350, 1.0624
Alternative scenario
Recommendation SELL STOP
Entry Point 1.0185
Take Profit 1.0000
Stop Loss 1.0250
Key Levels 1.0000, 1.0185, 1.0350, 1.0624

Current trend

The euro continues to strengthen locally in tandem with the US dollar after the publication of a positive report on the dynamics of consumer prices. Now the quotes of the EUR/USD pair are correcting in the area of 1.0246.

According to statistics, in June the indicator added 0.8% and the annual value reached 8.6%, which is fully consistent with the preliminary estimates of the market and representatives of the European Central Bank (ECB). These macroeconomic data will influence the decision of the members of the regulator during tomorrow's meeting on monetary policy, and the fact that inflation in the eurozone remains in line with expectations may signal an increase in interest rates in a standard 25 basis point increment, which will be enough to contain price increases. In this case, euro quotes will receive short-term support.

Meanwhile, according to The Wall Street Journal, EU oil tanker owners are ramping up their imports of Russian energy as much as possible ahead of the start of sanctions on sea supplies of raw materials adopted under the sixth package. Only in May and June, Greek ships entered Russian ports 151 times, although last year only 89 visits were recorded in the same period of time. Unprecedented demand for "black gold" has tripled the tariffs for its transportation. Experts are sure that after the entry into force of restrictions, the demand for oil will remain at the same high level and its deliveries will have to be made from more remote places, increasing, accordingly, transportation prices, which, in turn, will significantly increase the income of companies specializing in tanker shipping.

A rapid downtrend began in the quotes of the US dollar: in order for the USD Index to fall by a whole point at once, it was enough just to release yesterday's report on the volume of Housing Starts, which did not live up to analysts' expectations. In June, the indicator decreased by 2.0%, amounting to 1.559 million compared to forecasts of 1.580 million and the previous month's value of 1.591 million. On July 27, the US Federal Reserve will hold a meeting on monetary policy, and before this event, serious capital movements in the dollar should not be expected.

Support and resistance

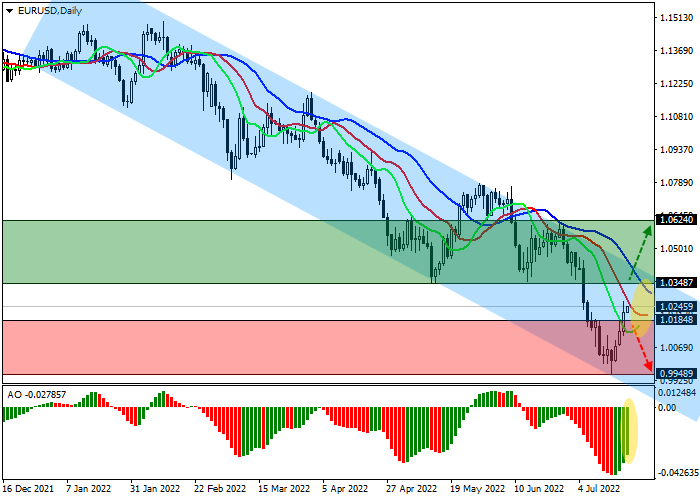
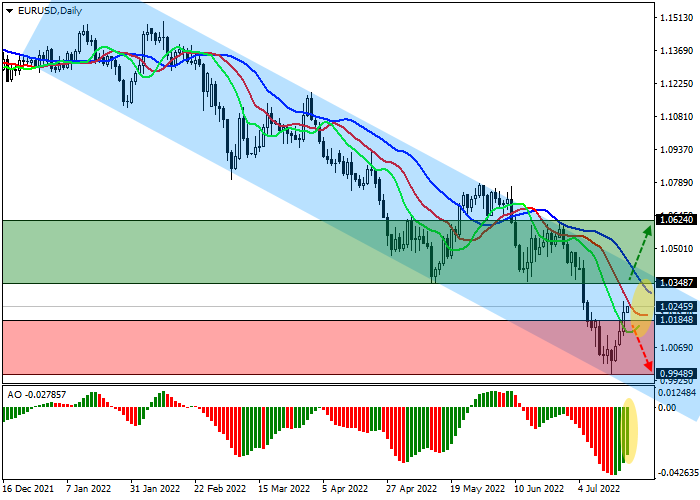
Despite the quite expected achievement of the absolute low of the year, EUR/USD remained within the global downward channel and is now forming another wave of growth. Technical indicators hurried to give a signal for the beginning of the correction: fast EMAs on the Alligator indicator are actively approaching the signal line, and the AO oscillator histogram is forming upward bars.

Support levels: 1.0185, 1.0000.

Resistance levels: 1.0350, 1.0624.
Trading tips

Long positions can be opened after a continued correctional growth of the asset, as well as consolidation of the price above the local resistance level of 1.0350 with the target of 1.0624. Stop-loss — 1.0250. Implementation time: 7 days and more.

Short positions can be opened after a reversal and continued decline in the asset, as well as consolidation of the price below the local support level of 1.0185 with the target of 1.0000. Stop-loss — 1.0250.
 

Jul 14, 2022

NZD/USD: instrument remains under pressure 14 July 2022, 11:39


Scenario
Timeframe Intraday
Recommendation SELL STOP
Entry Point 0.6070
Take Profit 0.6000
Stop Loss 0.6120
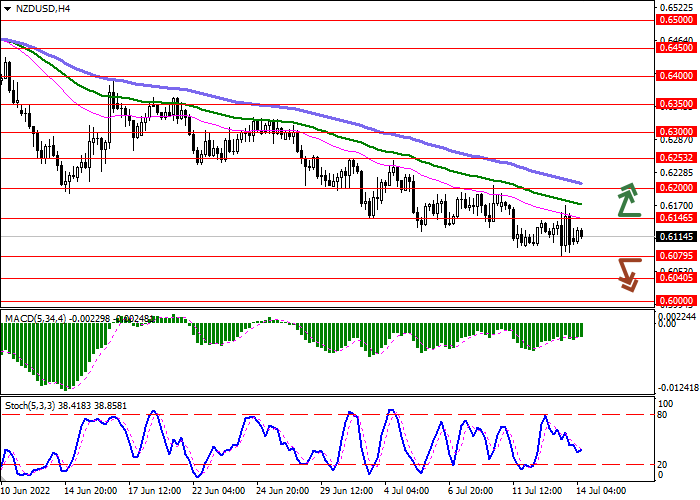
Key Levels 0.5960, 0.6000, 0.6040, 0.6079, 0.6146, 0.6200, 0.6253, 0.6300
Alternative scenario
Recommendation BUY STOP
Entry Point 0.6150
Take Profit 0.6253
Stop Loss 0.6100
Key Levels 0.5960, 0.6000, 0.6040, 0.6079, 0.6146, 0.6200, 0.6253, 0.6300

Current trend

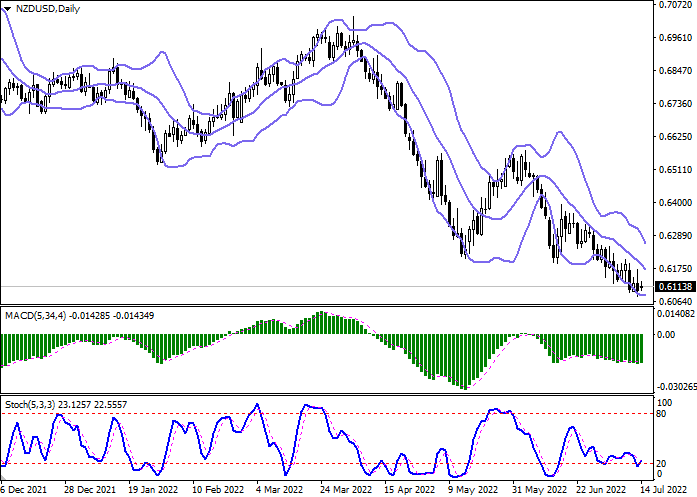
During the Asian session, the NZD/USD pair shows ambiguous trading dynamics, consolidating near 0.6110.

Yesterday, the trading instrument tried to grow actively, supported by the expected decision of the Reserve Bank of New Zealand (RBNZ) to raise the interest rate by 50 basis points. However, with the publication of US statistics on consumer prices, market participants again rushed to purchase the US dollar, expecting a tightening of monetary policy: the market is discussing the possibility of raising rates by 100 basis points. The inflation in the US hit a new 40-year high at 9.1% YoY, while analysts expected acceleration from only 8.6% to 8.8%, and the figure rose from 1.0% to 1.3 % MoM, beating market forecasts by 1.1%.

The regulator of New Zealand noted that soon, there are risks of further inflation growth, which could negatively affect the economic situation in the country as a whole. Still, according to current estimates, it is 6.9%, the highest value over the past 30 years. Until the end of the year, the agency plans to raise the rate by another 1% to 3.5%, and by 2024 the figure may reach 4% or more if the situation requires it.

Support and resistance

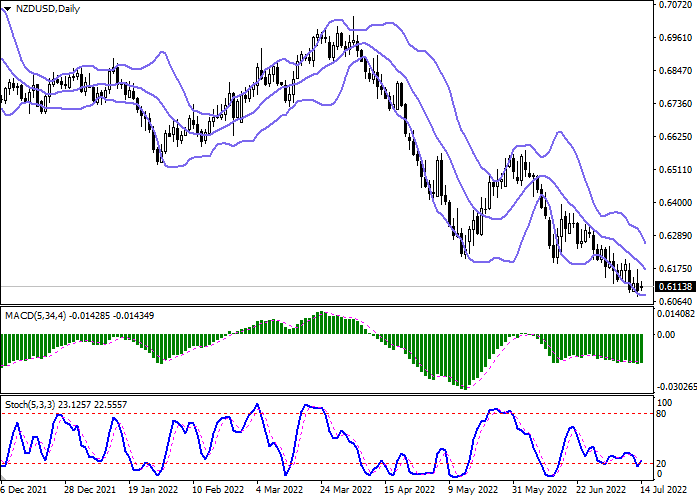
On the daily chart, Bollinger Bands are steadily declining. The price range is narrowing, reflecting the emergence of ambiguous trading dynamics in the short term. The MACD indicator is growing, trying to form a poor buy signal (the histogram tends to consolidate above the signal line). Stochastic is showing similar dynamics, retreating from its lows, which reflected that the New Zealand dollar might become oversold in the ultra-short term.

Resistance levels: 0.6146, 0.6200, 0.6253, 0.6300.

Support levels: 0.6079, 0.6040, 0.6000, 0.5960.

Trading tips

Short positions may be opened after the breakdown of 0.6079, with the target at 0.6000. Stop loss – 0.6120. Implementation period: 2–3 days.

Long positions may be opened after the breakout of the level 0.6146 with the target at 0.6253. Stop loss – 0.6100.

USD/JPY: dollar hits record highs 14 July 2022, 11:38


Scenario
Timeframe Intraday
Recommendation BUY
Entry Point 138.75
Take Profit 140.50
Stop Loss 137.50
Key Levels 134.54, 135.57, 136.69, 137.50, 138.50, 139.50, 140.50.
Alternative scenario
Recommendation SELL STOP
Entry Point 137.45
Take Profit 135.57
Stop Loss 138.50
Key Levels 134.54, 135.57, 136.69, 137.50, 138.50, 139.50, 140.50.

Current trend

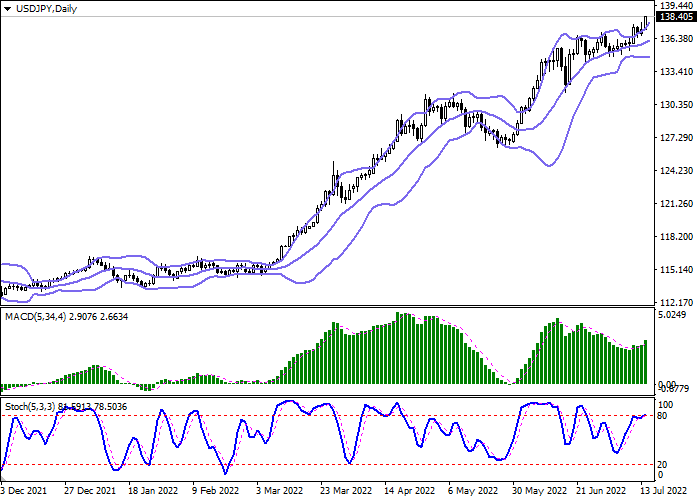
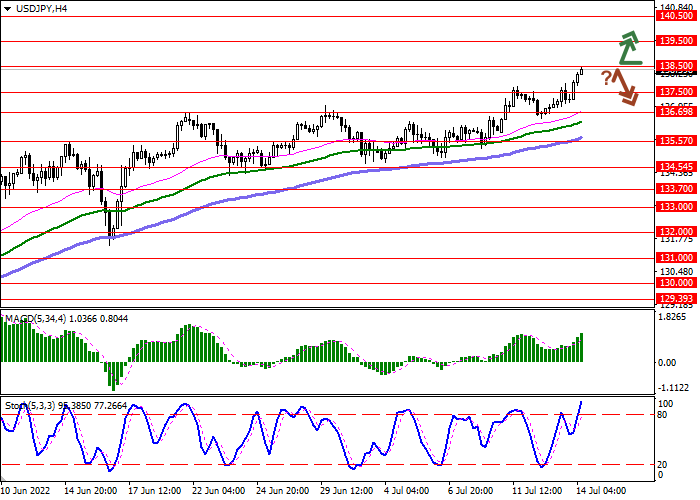
The US currency is showing active growth, renewing record highs and testing the level of 138.35 for a breakout, having received support from expectations of further tightening of monetary policy by the US Federal Reserve.

Yesterday's macroeconomic statistics from the US reflected a sharp increase in inflationary pressure in June from 8.6% to 9.1%, which was a new high in 40 years. Despite the actions of the US regulator, inflation continues to increase, reacting to the difficult situation in the energy market and supply disruptions. The Fed is forced to continue tightening monetary policy, despite the growing risks of a recession in the national economy. It is assumed that on July 27 the regulator will raise the interest rate by at least 75 basis points, but after the release of inflation data, an increase by 100 basis points is quite likely, especially since the Bank of Canada made a similar decision the day before.

In turn, the yen today came under pressure from macroeconomic statistics: Industrial Production fell by 7.5% MoM and 4.7% YoY, which was significantly worse than the expected contraction of 7.2% MoM and 2.8% YoY.

Support and resistance

Bollinger Bands in D1 chart show moderate growth. The price range is expanding from above but it fails to conform to the surge of "bullish" activity at the moment. MACD indicator is growing, while preserving a rather stable buy signal (located above the signal line). Stochastic retains upward direction but is located near its highs, which indicates the risks of overbought USD in the ultra-short term.

Resistance levels: 138.50, 139.50, 140.50.

Support levels: 137.50, 136.69, 135.57, 134.54.

Trading tips

Long positions can be opened after a breakout of 138.50 with the target of 140.50. Stop-loss — 137.50. Implementation time: 1-2 days.

A rebound from 138.50 as from resistance, followed by a breakdown of 137.50 may become a signal for opening of new short positions with the target at 135.57. Stop-loss — 138.50.

XAU/USD: gold is ready for a local reversal 14 July 2022, 11:37


Scenario
Timeframe Weekly
Recommendation BUY STOP
Entry Point 1745.5
Take Profit 1786.0
Stop Loss 1720.0
Key Levels 1685.0, 1707.0, 1745.0, 1786.0
Alternative scenario
Recommendation SELL STOP
Entry Point 1706.5
Take Profit 1685.0
Stop Loss 1720.0
Key Levels 1685.0, 1707.0, 1745.0, 1786.0

Current trend

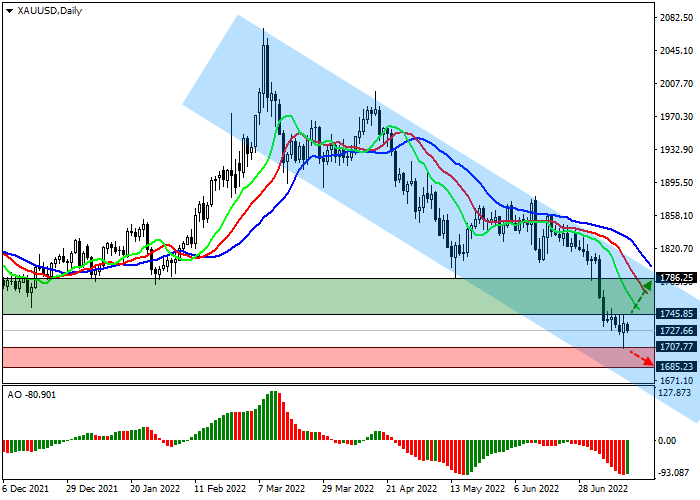
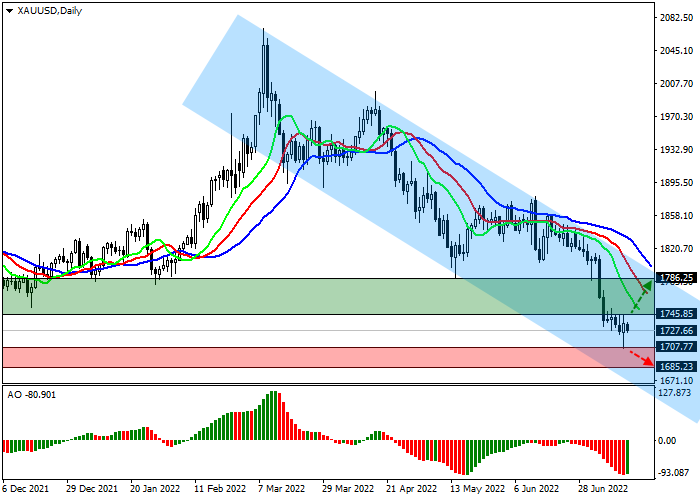
The XAU/USD pair is correcting within a downtrend at 1727.00. The trading instrument is declining in response to the growth of the US dollar, which continues to renew multi-year highs.

There are only three most liquid equivalent assets in the global economy: the US dollar, oil, and gold. When one of them rises sharply, the other two always fall, which is what is happening now: the oil price has fallen below 100.00, and gold quotes are approaching 1700.00. This situation cannot last long: the issue of the US currency causes an increase in inflation, which has already exceeded 9.0%, which means that the purchasing power of the population has decreased again, and this will lead to a drop in demand for the dollar, which will provoke an increase in oil and gold.

Primary signs of this process can be seen in the latest data from the Commodity Futures Trading Commission (CFTC). According to its recent report, in all major categories, there is a preponderance of contracts in favor of sellers. For example, swap dealers had 217,444K sell positions against 90,707K buy positions. At the same time, the weekly dynamics of change suggest that the "bears" are starting to get rid of their contracts actively and are gradually turning into "bulls": for example, over the past week, the number of sell positions has decreased by 15.748K, while the buy positions, on the contrary, increased by 1,849K.

Support and resistance

On the daily chart of the asset, the price is moving within the global downward channel. Technical indicators maintain a sell signal, not excluding a slight correction: fast EMAs on the Alligator indicator are below the signal line, and the AO oscillator histogram has formed the first rising bar in the sell zone.

Resistance levels: 1745.0, 1786.0.

Support levels: 1707.0, 1685.0.

Trading tips

Long positions may be opened after a reversal, growth, and consolidation of the price above 1745.0 with the target at 1786.0. Stop loss is 1720.0. Implementation period: 7 days or more.

Short positions may be opened after the price drops and consolidates below 1707.0 with the target at 1685.0. Stop loss is 1720.0.

EUR/USD: the pair is preparing to consolidate below the historical low 14 July 2022, 11:35


Scenario
Timeframe Weekly
Recommendation SELL STOP
Entry Point 0.9975
Take Profit 0.9800
Stop Loss 1.0050
Key Levels 0.9800, 0.9980, 1.0150, 1.0370
Alternative scenario
Recommendation BUY STOP
Entry Point 1.0155
Take Profit 1.0370
Stop Loss 1.0100
Key Levels 0.9800, 0.9980, 1.0150, 1.0370

Current trend

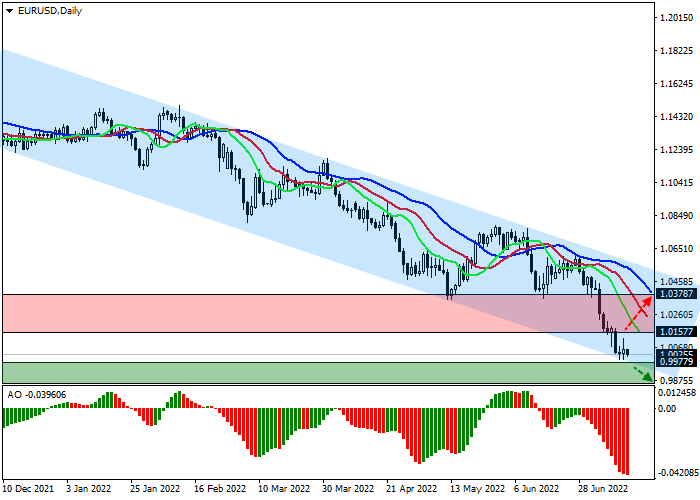
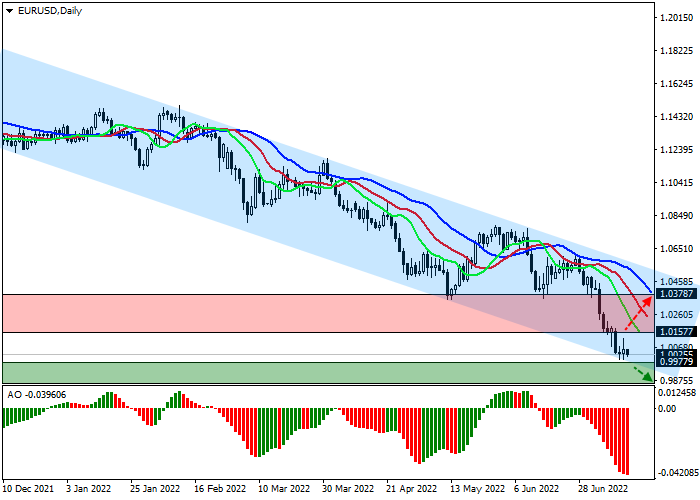
The EUR/USD pair is moving within a downtrend, trading around 1.0020.

Conflicting macroeconomic statistics from the EU do not allow the euro to interrupt the protracted decline: inflation in Germany in June was 7.6%, which is the same as in May, and CPI in France rose not as much as analysts expected but still amounted to 5.8%, up from 5.2% in May, while the same figure for Spain reached a record high of 10.2%, up sharply from 8.7% in May. With such a significant increase in local values, the composite price index of the EU countries will also increase significantly, preventing a possible reversal and growth of the euro.

The US dollar expectedly consolidated above 108,000 in the USD Index after the release of the US CPI, which for the first time since 1981 amounted to 9.1%, which is 0.5% higher than in May. Yesterday, several experts pointed to a possible rise in inflation above 9.0%. They noted that in this case, a rate increase by 75 basis points at the upcoming US Federal Reserve meeting is practically guaranteed and did not even rule out the option of increasing the rate by 100 basis points, which would provide the dollar with another short-term positive momentum.

Support and resistance

The trading instrument moves within the global downward channel, near the support line. Technical indicators maintain a global sell signal: fast EMAs on the Alligator indicator expand the range of fluctuations in the direction of decline, and the AO oscillator histogram forms downward bars in the sell zone.

Resistance levels: 1.0150, 1.0370.

Support levels: 0.9980, 0.9800.

Trading tips

Short positions may be opened after the price drops and consolidates below 0.9980 with the target at 0.9800. Stop loss – 1.0050. Implementation period: 7 days or more.

Long positions may be opened after a reversal, growth, and consolidation above 1.0150, with the target around 1.0370. Stop loss – 1.0100.

Jul 13, 2022

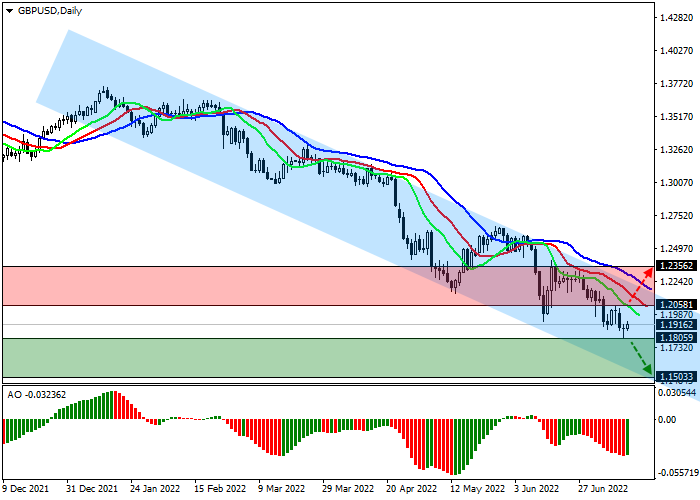
GBP/USD: investors do not believe in the strengthening of the pound 13 July 2022, 13:12


Scenario
Timeframe Weekly
Recommendation SELL STOP
Entry Point 1.1800
Take Profit 1.1500
Stop Loss 1.1900
Key Levels 1.1500, 1.1806, 1.2058, 1.2356
Alternative scenario
Recommendation BUY STOP
Entry Point 1.2065
Take Profit 1.2356
Stop Loss 1.2000
Key Levels 1.1500, 1.1806, 1.2058, 1.2356

Current trend

Due to the stable growth of the American currency, the GBP/USD pair is declining, trading around 1.1911.

Today's large block of macroeconomic data did not affect the downward dynamics of the pound: UK GDP was 0.5% in May, which is slightly better than the 0.1% increase expected by analysts, but the quarterly figure slowed down compared to April's 0.8%, amounting to 0.4%. The annual value decreased to 3.5% from 3.7% earlier, which indicates dangerous proximity to a full-fledged recession. Industrial production for the same period was 0.9%, higher than the forecast growth of 0.2%, and the annual rate continued to slow down at 1.4%, slightly worse than the 1.6% increase in April.

The US dollar slowed down, dropping slightly below 108.000 in the USD Index against investors' expectations of today's publication of inflation data, which will directly affect the further actions of the US Federal Reserve. Analysts suggest that the rate will rise to 8.8% from 8.6%, but some experts fear reaching 9.0%, which could lead to a rise in interest rates by 1.0%.

Support and resistance

The trading instrument moves within the global downward channel, gradually approaching the support line. Technical indicators keep a sell signal, and a possible renewal of the local low of the year at 1.1806 strengthens it: indicator Alligator's EMA oscillation range expands downward, and the AO oscillator histogram forms downward bars.

Resistance levels: 1.2058, 1.2356.

Support levels: 1.1806, 1.1500.

Trading tips

Short positions may be opened after the price drops and consolidates below 1.1806 with the target at 1.1500. Stop loss is 1.1900. Implementation period: 7 days or more.

Long positions may be opened after a reversal, growth, and prices above 1.2058 with the target at 1.2356. Stop loss is 1.2000.


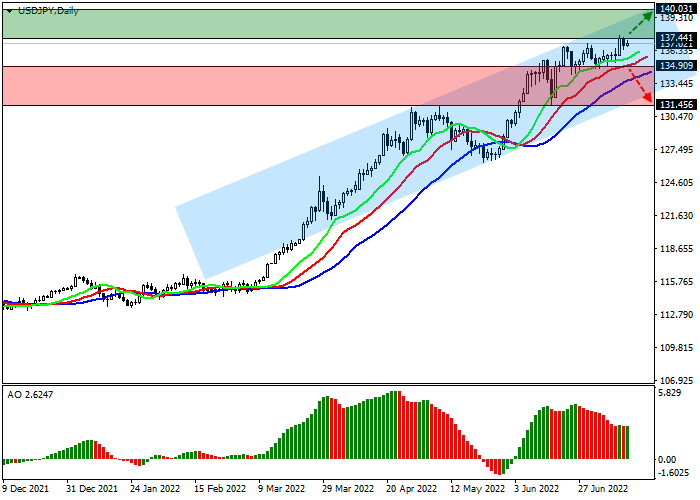
USD/JPY: currency pair continues to rise 13 July 2022, 11:26


Scenario
Timeframe Weekly
Recommendation BUY STOP
Entry Point 137.50
Take Profit 140.00
Stop Loss 137.00
Key Levels 131.45, 134.90, 137.44, 140.00
Alternative scenario
Recommendation SELL STOP
Entry Point 134.85
Take Profit 131.45
Stop Loss 136.00
Key Levels 131.45, 134.90, 137.44, 140.00

Current trend

Against the background of the stabilization of the US currency, the USD/JPY pair is correcting around the level of 137.00.

The downward dynamics of the national currency are developing despite the measures to purchase assets for record amounts taken by the Bank of Japan. However, there is still hope for early stabilization of the yen: the elections to the country's parliament ended yesterday, in which the party of the current Prime Minister Fumio Kishida won. The government's approval rating rose to a record high of 63.2%, which means that aggressive monetary policy is likely to continue. Also, investors are encouraged by positive macroeconomic indicators: the corporate goods price index in June rose by 0.7%, which is higher than the 0.5% expected by analysts, and by 9.2% YoY, which exceeds the forecast of 8.8% and only 0.1% lower than last month.

US consumer price data will be published today, which can update the historical record and rise to 8.8% from 8.6% a month earlier, in anticipation of which investors are in no hurry to enter the market, having stabilized the US dollar near 108.000 in the USD Index. The decision of the US Federal Reserve on monetary policy will also depend on inflation data: experts have repeatedly expressed the opinion that if the indicators rise above 9.0%, the regulator can immediately raise the rate by 100 basis points.

Support and resistance

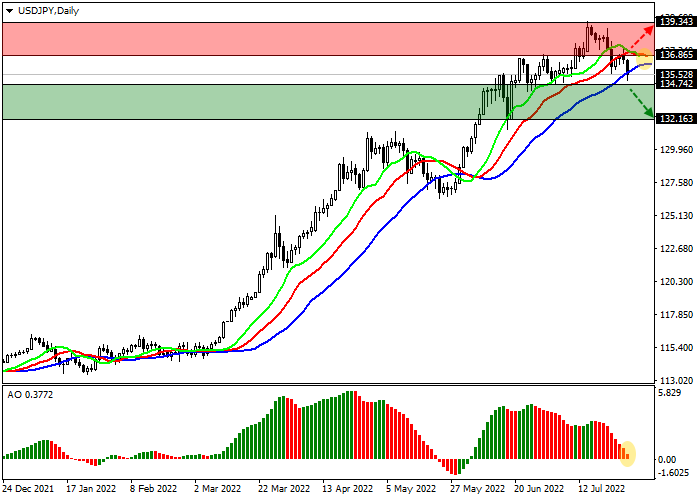
The trading instrument is moving within the global uptrend, holding slightly below the year's high at 137.40. Technical indicators maintain a stable buy signal: indicator Alligator's EMA oscillation range remains wide, and the AO oscillator histogram forms new bars high in the buy zone.

Resistance levels: 137.44, 140.00.

Support levels: 134.90, 131.45.

Trading tips

Long positions may be opened after the price rises and consolidates above 137.44 with the target at 140.00. Stop loss is 137.00. Implementation period: 7 days or more.

Short positions may be opened after a reversal, decrease, and consolidation of the price below 134.90 with the target at 131.45. Stop loss is 136.00.

USD/CAD: the pair is trading ambiguously 13 July 2022, 11:25


Scenario
Timeframe Intraday
Recommendation BUY STOP
Entry Point 1.3055
Take Profit 1.3150
Stop Loss 1.3000
Key Levels 1.2850, 1.2900, 1.2950, 1.3000, 1.3050, 1.3100, 1.3150, 1.3200
Alternative scenario
Recommendation SELL STOP
Entry Point 1.2945
Take Profit 1.2850
Stop Loss 1.3000
Key Levels 1.2850, 1.2900, 1.2950, 1.3000, 1.3050, 1.3100, 1.3150, 1.3200

Current trend

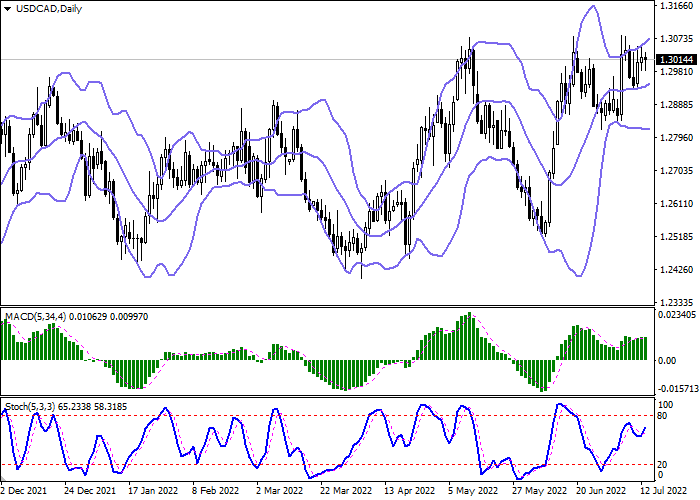
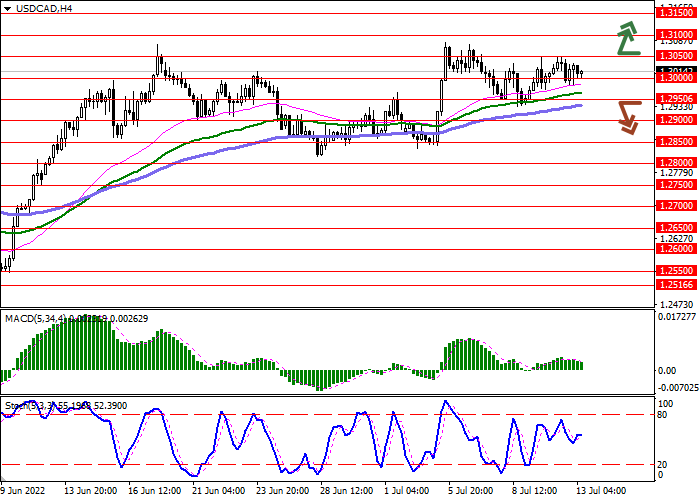
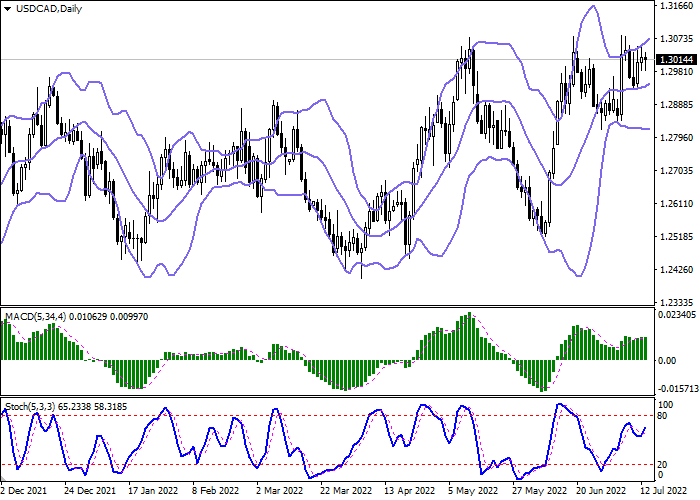
During the Asian session, the USD/CAD pair is moderately declining and testing 1.3000 for a breakdown, correcting after a two-day increase, but the "bears" are still acting indecisively.

Activity on the trading instrument remains quite low, as investors prefer to wait for today's release of key US macroeconomic statistics on consumer price dynamics, which, according to forecasts, will rise to 8.8%, which will put additional pressure on the US Federal Reserve's decision to tighten monetary policy further. Several analysts do not rule out an increase in the indicator to the psychological mark of 9.0%, which may force the regulator to raise the rate by 75 basis points at once. Also, the economic review of the Beige book department and the monthly report on the state of the US budget for June will be published on Wednesday.

Today, the Bank of Canada will announce its decision on monetary policy: analysts' forecast suggests an active increase in interest rates by 75 basis points to 2.25%, but the regulator may decide to act at a more relaxed pace since the June report on the labor market was somewhat disappointing experts: the employment rate fell sharply by 43.2K, while analysts expected it to grow by 23.5K, and the unemployment rate fell from 5.1% to 4.9%.

Support and resistance

On the daily chart, Bollinger bands are growing moderately. The price range is expanding from above, letting the "bulls" renew local highs. The MACD indicator is growing, keeping a poor buy signal (the histogram is above the signal line). After a short decline at the end of the last trading week, Stochastic is again trying to reverse upwards, located near its highs.

Resistance levels: 1.3050, 1.3100, 1.3150, 1.3200.

Support levels: 1.3000, 1.2950, ​​1.2900, 1.2850.

Trading tips

Long positions may be opened after the breakout of the level 1.3050 with the target at 1.3150. Stop loss – 1.3000. Implementation period: 2–3 days.

Short positions may be opened after the breakdown of 1.2950 with the target at 1.2850. Stop loss – 1.3000.


If you are interested or have any questions - Contact us!