
USD/CAD: ambiguous trading dynamics
01 April 2021, 11:48

| Scenario | |
|---|---|
| Timeframe | Intraday |
| Recommendation | BUY STOP |
| Entry Point | 1.2605 |
| Take Profit | 1.2650, 1.2670 |
| Stop Loss | 1.2570 |
| Key Levels | 1.2439, 1.2500, 1.2538, 1.2570, 1.2600, 1.2627, 1.2650, 1.2700 |
| Alternative scenario | |
|---|---|
| Recommendation | SELL STOP |
| Entry Point | 1.2565 |
| Take Profit | 1.2500 |
| Stop Loss | 1.2610 |
| Key Levels | 1.2439, 1.2500, 1.2538, 1.2570, 1.2600, 1.2627, 1.2650, 1.2700 |
Current trend
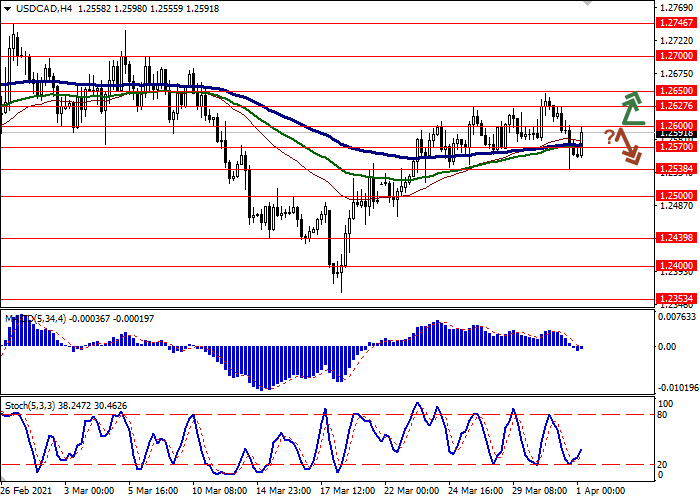
Today, during the Asian session, the USD/CAD pair is recovering, testing the level of 1.2600 for a breakout.
The US dollar weakened yesterday, despite the publication of a strong ADP report on private sector employment, which reflected a rise in new jobs of 517K after rising by 176K last month. The indicator was less than the forecasts of 550K but reflected the stable upward trends in the economy and allowed traders to hope for the optimistic results of Friday's report on the US labor market for March.
Canadian statistics also was quite optimistic. Canadian GDP for January 2021 rose by 0.7% MoM, accelerating sharply from the minimum growth of 0.1% MoM for December. Analysts had expected an increase but had hoped for only +0.5% MoM. The index of prices for industrial products in Canada for February also increased from +2.0% to +2.6% MoM.
Support and resistance
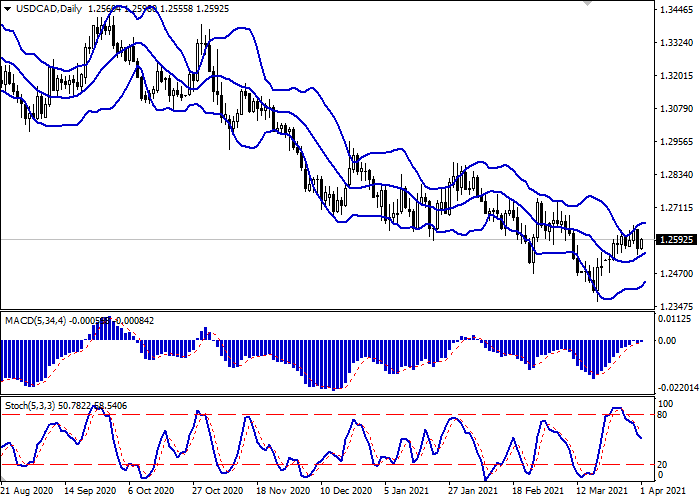
On the daily chart, Bollinger bands are rising moderately. The price range is actively narrowing, reflecting the emergence of ambiguous trading dynamics in the short term. The MACD indicator is growing, maintaining a poor buy signal (the histogram is above the signal line), and is trying to consolidate above the zero level. Stochastic, on the contrary, maintains a confident downward trend and does not react to the resumption of growth on Thursday.
Resistance levels: 1.2600, 1.2627, 1.2650, 1.2700.
Support levels: 1.2570, 1.2538, 1.2500, 1.2439.
Trading tips
Long positions may be opened after the breakout of 1.2600 with the targets at 1.2650–1.2670. Stop loss – 1.2570. Implementation period: 2–3 days.
Short positions may be opened after the rebound from 1.2600 and the breakdown of 1.2570 with the target at 1.2500. Stop loss – 1.2610.


No comments:
Write comments