
USD/JPY: return to the record highs
15 March 2021, 10:30
| Scenario | |
|---|---|
| Timeframe | Intraday |
| Recommendation | BUY STOP |
| Entry Point | 109.40 |
| Take Profit | 110.23 |
| Stop Loss | 108.85 |
| Key Levels | 107.78, 108.15, 108.63, 109.00, 109.37, 109.84, 110.23 |
| Alternative scenario | |
|---|---|
| Recommendation | SELL STOP |
| Entry Point | 108.95 |
| Take Profit | 108.15 |
| Stop Loss | 109.50 |
| Key Levels | 107.78, 108.15, 108.63, 109.00, 109.37, 109.84, 110.23 |
Current trend
USD continues to rally against JPY during today's morning session, trading near record highs and again trying to consolidate above the psychological level of 109.00. USD is in high demand amid yet another rise in the yield on US Treasury bonds. In addition, low demand for safe assets puts additional pressure on JPY.
Macroeconomic statistics from Japan published today does not have a significant impact on the dynamics of the instrument. Machinery Orders in Japan in January decreased by 4.5% MoM after growth by 5.2% MoM in the previous month. Analytical forecasts assumed a decrease in the indicator by 5.5% MoM. On an annualized basis, the indicator slowed sharply from +11.8% YoY to +1.5% YoY, which nevertheless was better than the negative forecasts of analysts at –0.2% YoY.
Support and resistance
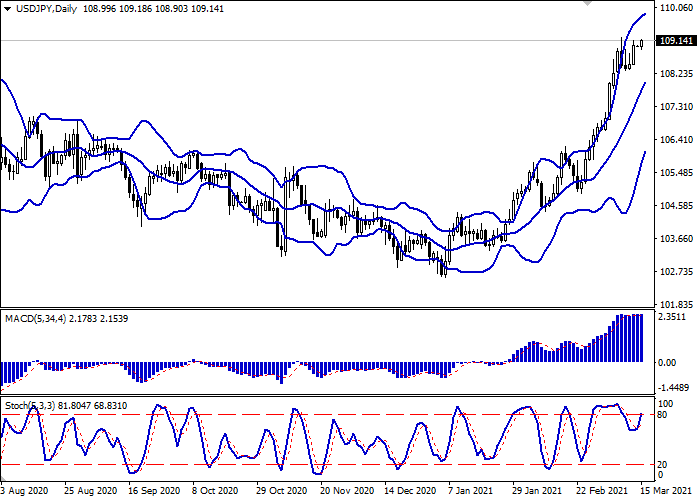
Bollinger Bands in D1 chart show stable growth. The price range is narrowing, reflecting ambiguous dynamics of trading in the short term. MACD indicator is growing preserving a weak buy signal (located above the signal line). Stochastic reversed upwards again after a short decline last week. The indicator readings continue to indicate that USD is overbought in the ultra-short term.
Current showings of the indicators do not contradict the further development of the "bullish" trend in the short term.
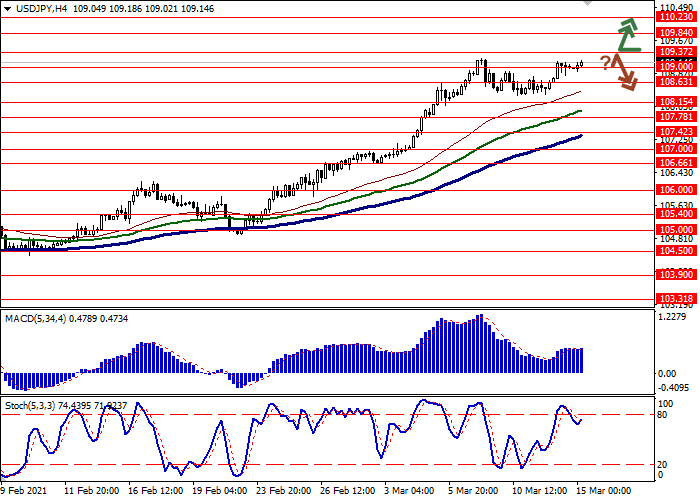
Resistance levels: 109.37, 109.84, 110.23.
Support levels: 109.00, 108.63, 108.15, 107.78.

Trading tips
To open long positions, one can rely on the breakout of 109.37. Take-profit – 110.23. Stop-loss – 108.85. Implementation time: 1-2 days.
A rebound from 109.37 as from resistance, followed by a breakdown of 109.00 may become a signal for new sales with the target at 108.15. Stop-loss – 109.50.


No comments:
Write comments