
USD/CAD: recovery after a minor correction
02 March 2021, 10:20

| Scenario | |
|---|---|
| Timeframe | Intraday |
| Recommendation | BUY STOP |
| Entry Point | 1.2700 |
| Take Profit | 1.2800 |
| Stop Loss | 1.2637 |
| Key Levels | 1.2500, 1.2540, 1.2570, 1.2637, 1.2700, 1.2746, 1.2800, 1.2850 |
| Alternative scenario | |
|---|---|
| Recommendation | SELL STOP |
| Entry Point | 1.2635 |
| Take Profit | 1.2540 |
| Stop Loss | 1.2700 |
| Key Levels | 1.2500, 1.2540, 1.2570, 1.2637, 1.2700, 1.2746, 1.2800, 1.2850 |
Current trend
Today during the Asian session, the USD/CAD pair grows moderately, recovering from Monday's decline, which did not allow it to renew local highs.
Yesterday’s USD weakening was largely technical since the fundamental picture did not change significantly. Some pressure on the price was exerted by the decline in the yield of American bonds, however, positive US macroeconomic statistics helped to smooth out this negative effect. Thus, ISM Manufacturing PMI for February rose from 58.7 to 60.8 points, while the forecasts assumed growth only to 58.8 points. Markit Manufacturing PMI rose from 58.5 to 58.6 points, in line with market expectations.
On Tuesday, investors are focused on a block of statistics on the dynamics of Canada's GDP for December and the fourth quarter of 2020. According to preliminary data, the country's economy slowed significantly at the end of last year, which is associated with continuing restrictions due to the coronavirus pandemic.
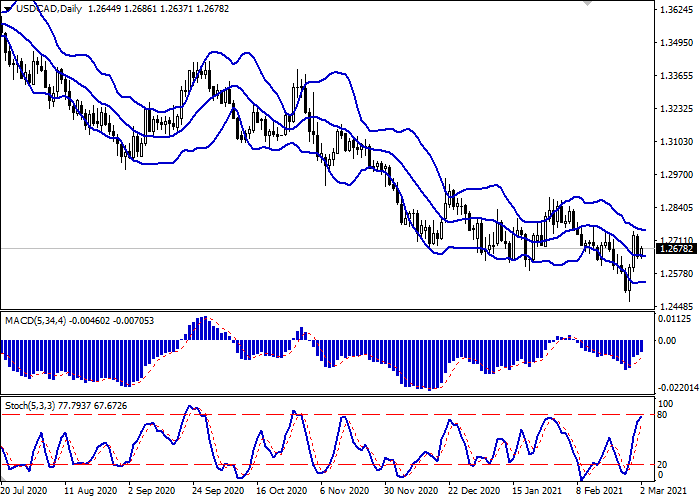
Support and resistance
On the daily chart, Bollinger Bands reverse horizontally. The price range tries to consolidate but remains spacious enough for the current level of activity in the market. MACD grows, maintaining a strong buy signal (the histogram is above the signal line). Stochastic grows but rapidly approaches its highs, signaling that the instrument may become overbought in the ultra-short term.
It is better to keep the current long positions until the signals from technical indicators are clarified.
Resistance levels: 1.2700, 1.2746, 1.2800, 1.2850.
Support levels: 1.2637, 1.2570, 1.2540, 1.2500.
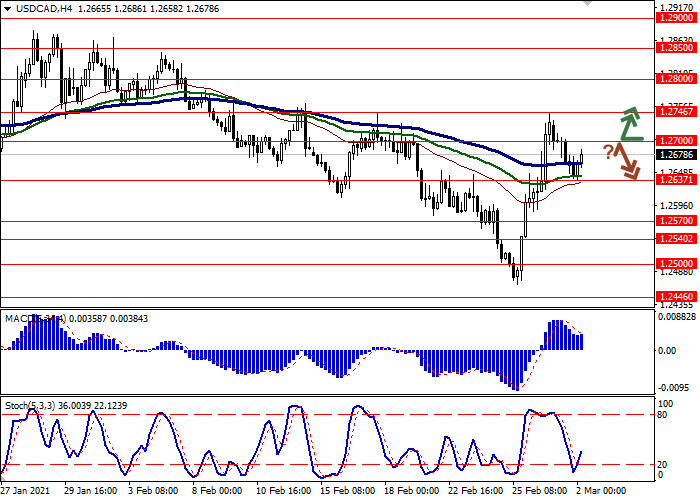
Trading tips
Long positions may be opened after the breakout of 1.2700 with the target at 1.2800. Stop loss is 1.2637. Implementation period: 1–2 days.
Short positions may be opened after the rebound from 1.2700 and the breakdown of 1.2637 with a target at 1.2540. Stop loss is 1.2700.


No comments:
Write comments