
EUR/USD: wave analysis
16 March 2021, 10:46
| Scenario | |
|---|---|
| Timeframe | Weekly |
| Recommendation | SELL |
| Entry Point | 1.1937 |
| Take Profit | 1.1684, 1.1485 |
| Stop Loss | 1.2020 |
| Key Levels | 1.1485, 1.1684, 1.2242, 1.2350, 1.2450 |
| Alternative scenario | |
|---|---|
| Recommendation | BUY STOP |
| Entry Point | 1.2245 |
| Take Profit | 1.2350, 1.2450 |
| Stop Loss | 1.2185 |
| Key Levels | 1.1485, 1.1684, 1.2242, 1.2350, 1.2450 |
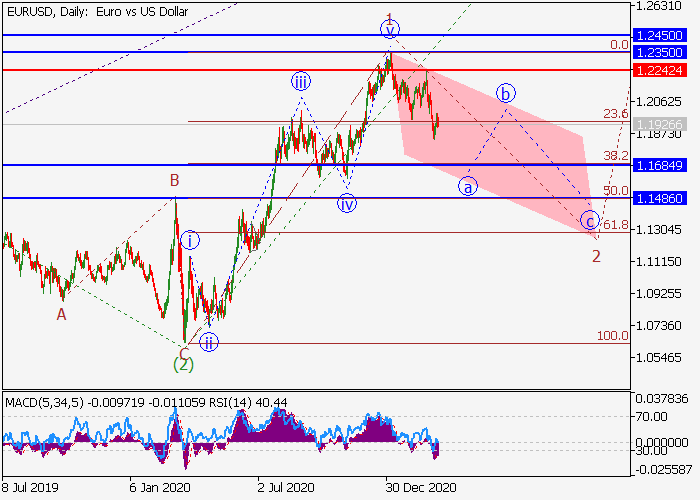
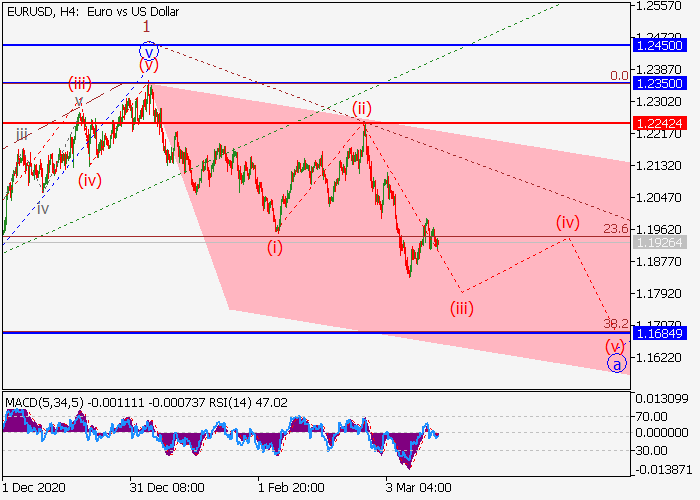
The pair may fall.
On the daily chart, the first wave of the higher level 1 of (3) developed, and a downward correction forms as the second wave 2 of (3). Now, the wave a of 2 is forming, within which the wave (iii) of a of 2 is developing. If the assumption is correct, the pair will fall to the levels of 1.1684–1.1485. In this scenario, critical stop loss level is 1.2242.

Main scenario
Short positions will become relevant during the correction, below the level of 1.2242 with the targets at 1.1684–1.1485. Implementation period: 7 days and more.
Alternative scenario
The breakout and the consolidation of the price above the level of 1.2242 will let the pair grow to the levels of 1.2350–1.2450.


No comments:
Write comments