
XAU/USD: wave analysis
19 February 2021, 08:42

| Scenario | |
|---|---|
| Timeframe | Weekly |
| Recommendation | SELL |
| Entry Point | 1770.20 |
| Take Profit | 1728.61, 1622.21 |
| Stop Loss | 1784.10 |
| Key Levels | 1622.21, 1728.61, 1855.08, 1959.38, 2075.45 |
| Alternative scenario | |
|---|---|
| Recommendation | BUY STOP |
| Entry Point | 1855.10 |
| Take Profit | 1959.38, 2075.45 |
| Stop Loss | 1820.30 |
| Key Levels | 1622.21, 1728.61, 1855.08, 1959.38, 2075.45 |
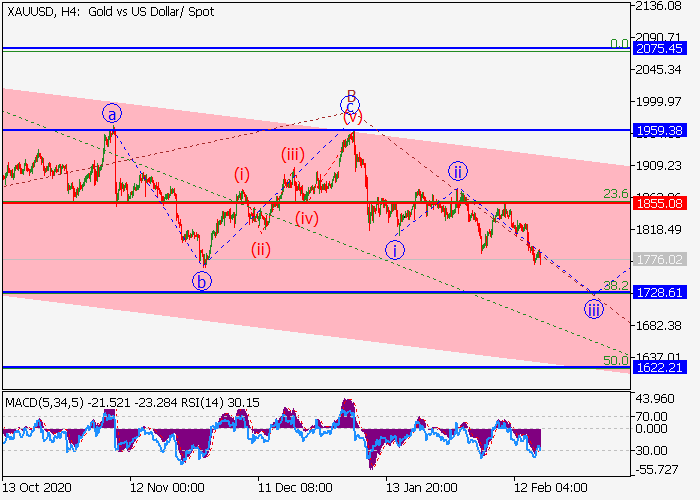
The pair is in a correction, a fall is possible.
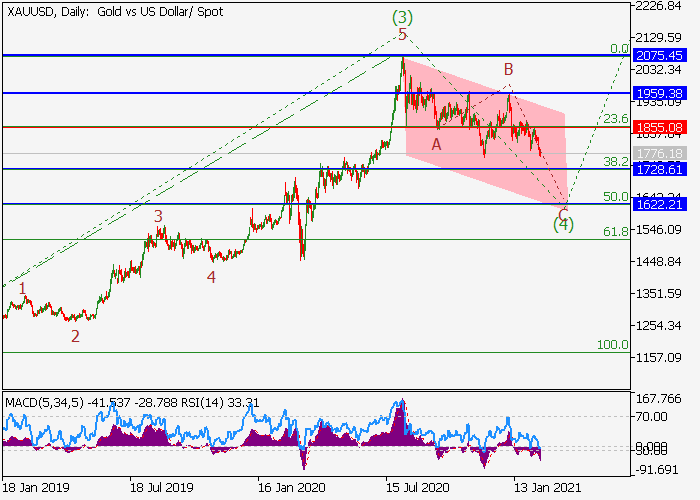
On the daily chart, the third wave of the higher level (3) formed, and a downward correction develops as the fourth wave (4). Now, the wave C of (4) is forming, within which the wave iii of C is developing. If the assumption is correct, the pair will fall to the levels of 1728.61–1622.21. In this scenario, critical stop loss level is 1855.08.
Main scenario
Short positions will become relevant during the correction, below the level of 1855.08 with the targets at 1728.61–1622.21. Implementation period: 7 days and more.
Alternative scenario
The breakout and the consolidation of the price above the level of 1855.08 will let the price grow to the levels of 1959.38–2075.45.


No comments:
Write comments