
USD/JPY: dollar is strengthening
03 February 2021, 11:59
| Scenario | |
|---|---|
| Timeframe | Intraday |
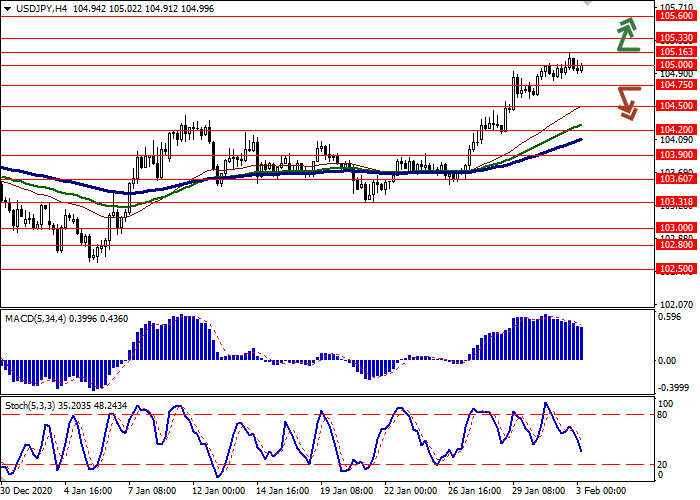
| Recommendation | BUY STOP |
| Entry Point | 105.20 |
| Take Profit | 105.60 |
| Stop Loss | 104.90 |
| Key Levels | 103.90, 104.20, 104.50, 104.75, 105.00, 105.16, 105.33, 105.60 |
| Alternative scenario | |
|---|---|
| Recommendation | SELL STOP |
| Entry Point | 104.70 |
| Take Profit | 104.20 |
| Stop Loss | 105.10 |
| Key Levels | 103.90, 104.20, 104.50, 104.75, 105.00, 105.16, 105.33, 105.60 |
Current trend
The US dollar maintains an upward trend against the Japanese yen, renewing local highs from November 12, 2020. Now, the American currency has added about 0.04% and is testing the strong resistance at the psychological level of 105.00. It is supported by the prospects for the early approval of a new stimulus package for the national economy of $1.9 trillion, which is likely to help the country recover to pre-crisis levels as early as 2021 (if the epidemiological situation in the country and the world does not begin to deteriorate again).
Wednesday’s macroeconomic statistics from Japan puts moderate pressure on the yen's position. Thus, the manufacturing PMI index from Jibun Bank in January fell from 47.7 to 46.1 points, which was worse than the average forecasts of analysts.
Support and resistance
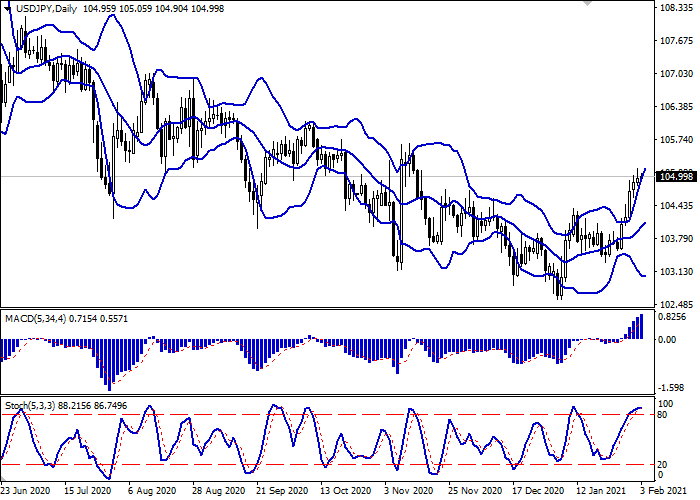
Bollinger bands are growing steadily on the daily chart. The price range is actively expanding from above but not as fast as the “bullish” dynamics develop in the short term. The MACD indicator is growing, maintaining a strong buy signal (the histogram is above the signal line). Stochastic, having approached its highs, reversed into a horizontal plane, reflecting that the dollar may become overbought in the ultra-short term.
It is better to keep the current long positions on the instrument until the signals from technical indicators are clarified.
Resistance levels: 105.00, 105.16, 105.33, 105.60.
Support levels: 104.75, 104.50, 104.20, 103.90.

Trading tips
Long positions may be opened after the breakout of 105.16 with the target at 105.60. Stop loss – 104.90. Implementation period: 1–2 days.
Short positions may be opened after the return of the “bearish” dynamics and the breakdown of 104.75 with the target at 104.20. Stop loss – 105.10.


No comments:
Write comments