
USD/CAD: technical analysis
16 February 2021, 10:04

| Scenario | |
|---|---|
| Timeframe | Weekly |
| Recommendation | SELL STOP |
| Entry Point | 1.2590 |
| Take Profit | 1.2374 |
| Stop Loss | 1.2650 |
| Key Levels | 1.2374, 1.2590, 1.2787, 1.3036 |
| Alternative scenario | |
|---|---|
| Recommendation | BUY STOP |
| Entry Point | 1.2787 |
| Take Profit | 1.3036 |
| Stop Loss | 1.2700 |
| Key Levels | 1.2374, 1.2590, 1.2787, 1.3036 |
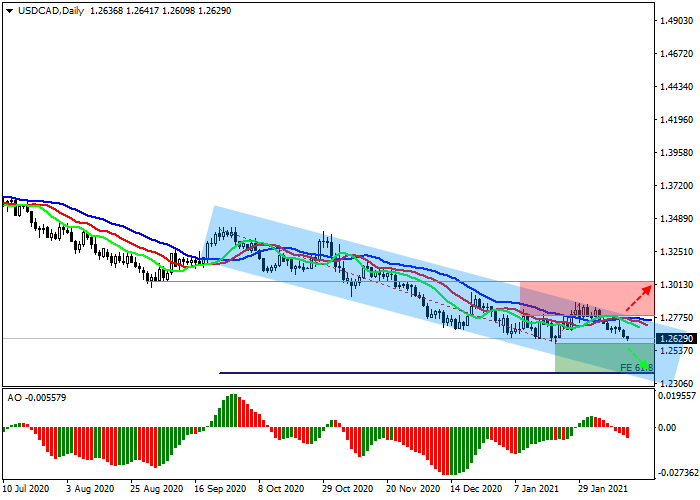
Current trend
The USD/CAD pair continues to decline in the global downtrend channel, having rebounded from the resistance line and trading at 1.2629.
At the local interval, the price is preparing to update the local low and move to the stage of a full-fledged downward wave formation. Technical indicators have already issued an updated sell signal. The range of EMA fluctuations on the Alligator indicator began to expand again, and the AO oscillator histogram is trading in the negative area.
Support and resistance
Resistance levels: 1.2787, 1.3036.
Support levels: 1.2590, 1.2374.
Trading tips
If the asset continues to decline and the price consolidates below the local low at 1.2590, short positions will be relevant in order to reach the Fibonacci retracement level of 61.8%, at 1.2374. Stop-loss – 1.2650. Implementation time: 7 days and more.
If the asset reverses and continues growing and the price consolidates above the local resistance level at 1.2787, long positions will be relevant with target at 1.3036. Stop-loss – 1.2700.


No comments:
Write comments