
USD/CAD: dollar remains under pressure
09 February 2021, 09:08

| Scenario | |
|---|---|
| Timeframe | Intraday |
| Recommendation | SELL STOP |
| Entry Point | 1.2695 |
| Take Profit | 1.2622 |
| Stop Loss | 1.2738 |
| Key Levels | 1.2589, 1.2622, 1.2664, 1.2700, 1.2738, 1.2770, 1.2800, 1.2850 |
| Alternative scenario | |
|---|---|
| Recommendation | BUY STOP |
| Entry Point | 1.2740 |
| Take Profit | 1.2800 |
| Stop Loss | 1.2700 |
| Key Levels | 1.2589, 1.2622, 1.2664, 1.2700, 1.2738, 1.2770, 1.2800, 1.2850 |
Current trend
Today, during the Asian session, the USD/CAD pair is slightly declining, developing a downtrend in the ultra-short term, which was formed at the end of the last trading week. The positions of the American currency are weakening practically across the entire spectrum of the market, as investors are encouraged by the prospects for a recovery in global economic growth and another surge in stock exchanges.
On Tuesday, traders are focusing on the retail sales dynamics from Redbook for the week of February 5. Also, investors are awaiting the release of the NFIB Business Optimism Index for January and the JOLTS Job Openings Report for December, which will help further analyze the US labor market report for January released on Friday.
Support and resistance
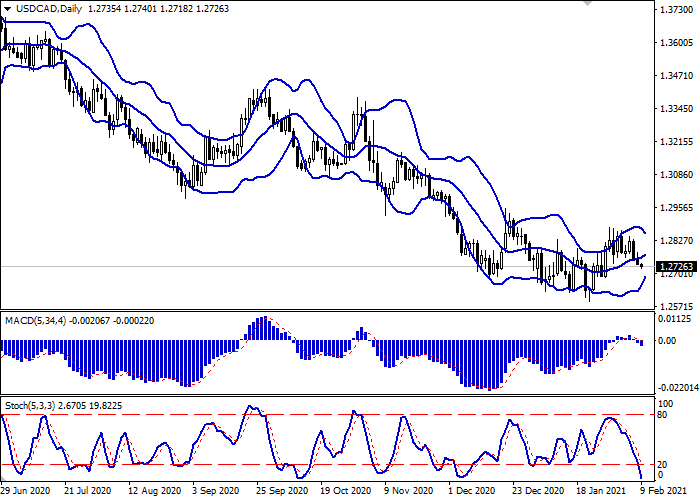
On the daily chart, Bollinger Bands are rising moderately. The price range is actively narrowing, reflecting a sharp change in the direction of trading in the ultra-short term. The MACD indicator is declining, maintaining a relatively strong sell signal (the histogram is below the signal line), and is trying to consolidate below the zero level. Stochastic maintains a confident downward trend, however, it is near its lows, signaling that USD may become oversold in the short term.
It is better to keep current short positions until the signals from technical indicators are clarified.
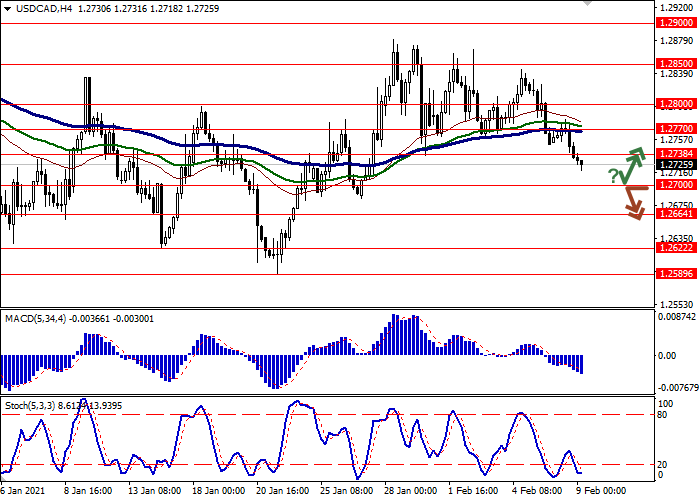
Resistance levels: 1.2738, 1.2770, 1.2800, 1.2850.
Support levels: 1.2700, 1.2664, 1.2622, 1.2589.
Trading tips
Short positions may be opened after the breakdown of 1.2700 with the target at 1.2622 and stop loss 1.2738. Implementation period: 2–3 days.
Long positions may be opened after the rebound from 1.2700 and the breakout of 1.2738 with the target at 1.2800. Stop loss – 1.2700.


No comments:
Write comments