
GBP/USD: the pound reaches record highs
10 February 2021, 10:33
| Scenario | |
|---|---|
| Timeframe | Intraday |
| Recommendation | BUY STOP |
| Entry Point | 1.3835 |
| Take Profit | 1.3963, 1.4000 |
| Stop Loss | 1.3760 |
| Key Levels | 1.3600, 1.3650, 1.3700, 1.3760, 1.3834, 1.3900, 1.3963, 1.4000 |
| Alternative scenario | |
|---|---|
| Recommendation | SELL STOP |
| Entry Point | 1.3755 |
| Take Profit | 1.3600 |
| Stop Loss | 1.3834 |
| Key Levels | 1.3600, 1.3650, 1.3700, 1.3760, 1.3834, 1.3900, 1.3963, 1.4000 |
Current trend
Today, during the Asian session, the GBP/USD pair is trading ambiguously, consolidating near the level of 1.3820 and the local highs since the end of April 2018.
Yesterday, the instrument was steadily climbing due to the poor positions of the US dollar. Additional support for the pound was provided by data on the dynamics of retail sales in the UK from the Confederation of British Industrialists in January.
On Wednesday, February 10, investors await the release of the NIESR estimate of the January GDP growth rate. Also, closer to the close of the daytime session, there will be speeches by the heads of the Fed and the Bank of England, who may clarify plans for monetary policy. Also, the January statistics on consumer inflation will be published today.
Support and resistance
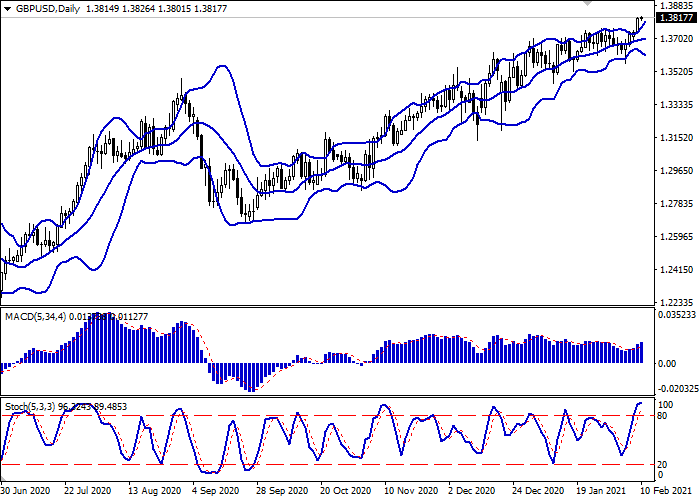
On the daily chart, Bollinger Bands are rising moderately. The price range is expanding but not as fast as the “bullish” dynamics develop in the short term. The MACD indicator is growing, maintaining a moderate buy signal (the histogram is above the signal line). Stochastic, having approached its highs, is reversing into a horizontal plane, indicating that the instrument may become overbought in the super short term.
It is better to keep the current long positions until the signals from technical indicators are clarified.
Resistance levels: 1.3834, 1.3900, 1.3963, 1.4000.
Support levels: 1.3760, 1.3700, 1.3650, 1.3600.
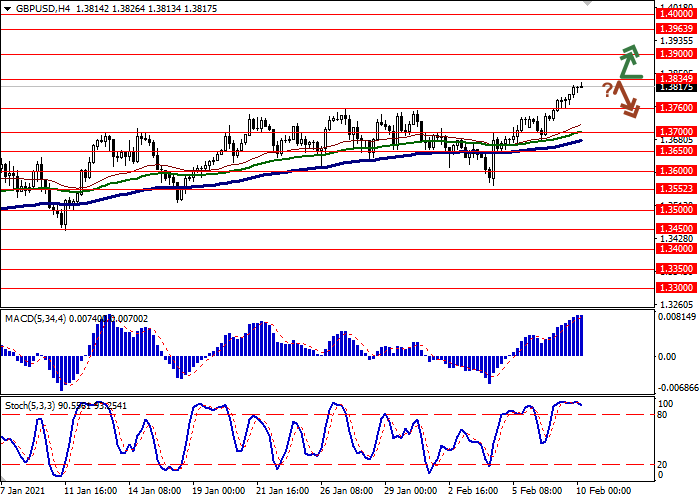

Trading tips
Long positions may be opened after the breakout of 1.3834 with the targets at 1.3963–1.4000. Stop loss is 1.3760. Implementation period: 2–3 days.
Short positions may be opened after the rebound from 1.3834 and the breakdown of 1.3760 with the target at 1.3600. Stop loss – 1.3834.


No comments:
Write comments