
EUR/USD: the instrument is updating record lows
03 February 2021, 11:53
| Scenario | |
|---|---|
| Timeframe | Intraday |
| Recommendation | SELL STOP |
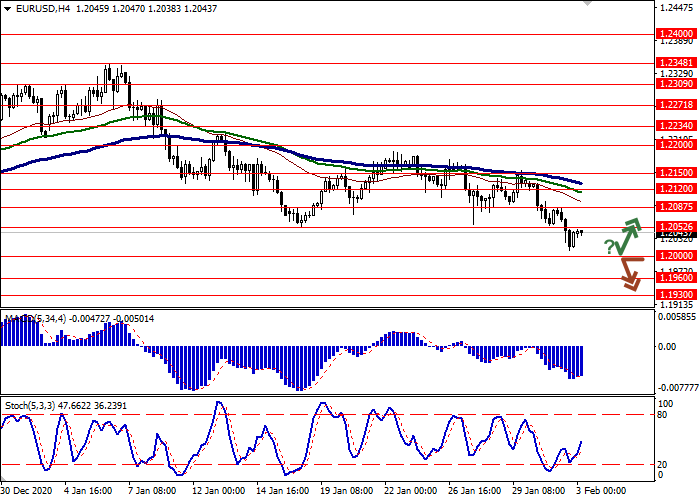
| Entry Point | 1.1995 |
| Take Profit | 1.1900 |
| Stop Loss | 1.2052 |
| Key Levels | 1.1900, 1.1930, 1.1960, 1.2000, 1.2052, 1.2087, 1.2120, 1.2150 |
| Alternative scenario | |
|---|---|
| Recommendation | BUY STOP |
| Entry Point | 1.2055 |
| Take Profit | 1.2150 |
| Stop Loss | 1.2000 |
| Key Levels | 1.1900, 1.1930, 1.1960, 1.2000, 1.2052, 1.2087, 1.2120, 1.2150 |
Current trend
EUR is showing ambiguous trading dynamics against USD during today's Asian session, consolidating after a two-day downside rally that has led to renewed local lows for the instrument since December 1. The pressure on EUR is increasing as quarantine restrictions persist in many European countries, as well as amid the ambiguous prospects for economic recovery in the region in early 2021.
Meanwhile, the macroeconomic data from Europe published on Tuesday managed to help the "bulls" a little. Eurozone GDP in Q4 2020 decreased by 0.7% QoQ after growing by 12.5% QoQ last month. Analysts expected a decrease of 1.2% QoQ. In annual terms, the economic decline accelerated from –4.3% YoY to –5.1% YoY, which again turned out to be better than the market forecasts at the level of –5.4% YoY. Today, investors are focused on the European statistics on business activity and consumer price levels for January.
Support and resistance
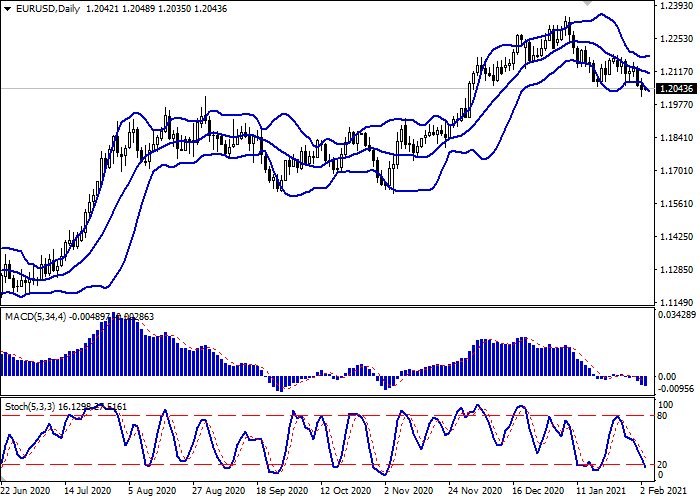
Bollinger Bands in D1 chart demonstrate a moderate decrease. The price range is expanding, but it fails to catch the development of "bearish" trend of recent days. MACD is going down keeping a fairly stable sell signal (located below the signal line). Stochastic is showing similar dynamics; however, it is rapidly approaching its lows, reflecting oversold EUR in the ultra-short term.
Resistance levels: 1.2052, 1.2087, 1.2120, 1.2150.
Support levels: 1.2000, 1.1960, 1.1930, 1.1900.

Trading tips
To open new short positions, one can rely on the breakdown of 1.2000. Take-profit – 1.1900. Stop-loss – 1.2052. Implementation time: 2-3 days.
A rebound from 1.2000 as from support followed by a breakout of 1.2052 may become a signal for new purchases with the target at 1.2150. Stop-loss – 1.2000.


No comments:
Write comments