
AUD/USD: "bullish" sentiments remain
22 February 2021, 09:45

| Scenario | |
|---|---|
| Timeframe | Intraday |
| Recommendation | BUY STOP |
| Entry Point | 0.7905 |
| Take Profit | 0.7973, 0.8000 |
| Stop Loss | 0.7850 |
| Key Levels | 0.7780, 0.7804, 0.7840, 0.7867, 0.7900, 0.7934, 0.7973, 0.8000 |
| Alternative scenario | |
|---|---|
| Recommendation | SELL STOP |
| Entry Point | 0.7865 |
| Take Profit | 0.7804 |
| Stop Loss | 0.7900 |
| Key Levels | 0.7780, 0.7804, 0.7840, 0.7867, 0.7900, 0.7934, 0.7973, 0.8000 |
Current trend
AUD has shown ambiguous trading dynamics against USD during today's Asian session, while also hitting record highs since mid-March 2018. The reason for the continued "bullish" sentiment on the instrument is the vulnerable positions in USD, as well as the growing demand for risky assets and the recovery of commodity markets.
In turn, the published macroeconomic statistics from Australia in recent days could be better. Friday's data reflected a decline in the Commonwealth Bank Services PMI in February from 55.6 to 54.1 points, which was worse than market expectations of 55.8 points. Manufacturing PMI corrected from 57.2 to 56.6 points, which was also weaker than the projected value of 57.3 points. Finally, investors reacted extremely negatively to the release of statistics on retail sales. In January, the volume of sales increased only by 0.6% MoM after a decrease of 4.1% MoM in the previous month. Analysts expected the indicator to grow by more significant 2% MoM.
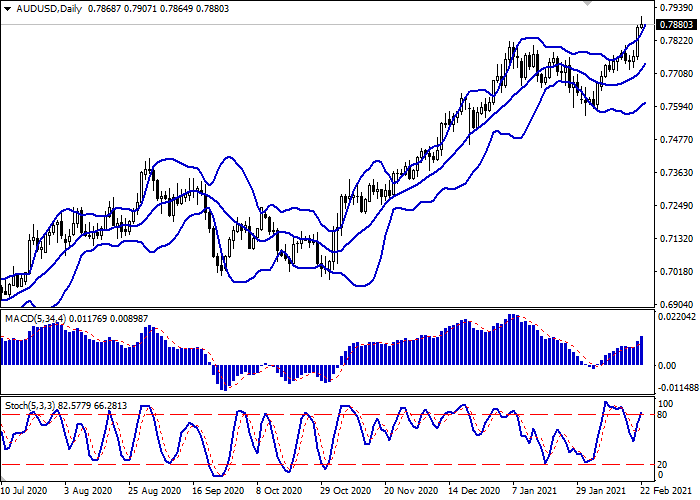
Support and resistance
Bollinger Bands in D1 chart show stable growth. The price range is expanding but it fails to conform to the development of "bullish" sentiments at the moment. MACD indicator is growing preserving a stable buy signal (located above the signal line). Stochastic shows similar dynamics but is approaching its highs, which indicates the risks of overbought instrument in the ultra-short term.
Resistance levels: 0.7900, 0.7934, 0.7973, 0.8000.
Support levels: 0.7867, 0.7840, 0.7804, 0.7780.
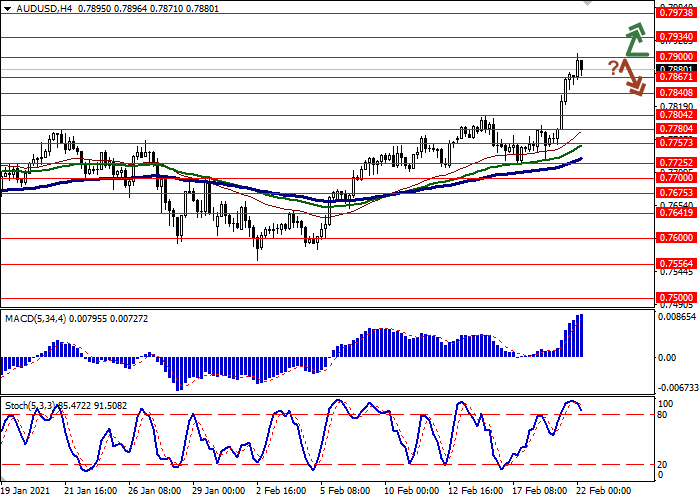
Trading tips
To open long positions, one can rely on the breakout of 0.7900. Take-profit – 0.7973–0.8000. Stop-loss – 0.7850. Implementation time: 2-3 days.
A rebound from 0.7900 as from resistance, followed by a breakdown of 0.7867 may become a signal for new sales with the target at 0.7804. Stop-loss – 0.7900.


No comments:
Write comments