
USD/JPY: technical analysis
14 January 2021, 12:52
| Scenario | |
|---|---|
| Timeframe | Intraday |
| Recommendation | BUY |
| Entry Point | 104.03 |
| Take Profit | 104.50 |
| Stop Loss | 103.70 |
| Key Levels | 102.60, 103.00, 103.30, 103.60, 103.90, 104.20, 104.50, 104.80 |
| Alternative scenario | |
|---|---|
| Recommendation | SELL STOP |
| Entry Point | 103.60 |
| Take Profit | 103.00 |
| Stop Loss | 103.90 |
| Key Levels | 102.60, 103.00, 103.30, 103.60, 103.90, 104.20, 104.50, 104.80 |
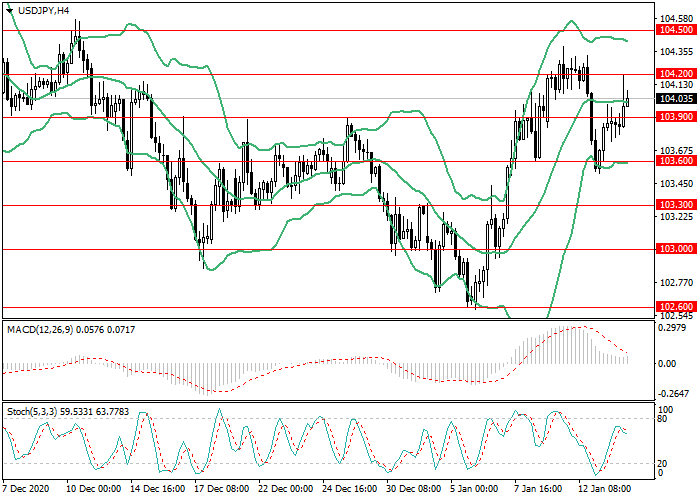
USD/JPY, H4
On the H4 chart, a lateral trend is forming. The instrument corrected to the center line of Bollinger Bands; the indicator cloud is narrowed and it is likely that lateral trend will persist in the short term. MACD histogram is in the positive area, with its volumes minimal; the signal line reversed downwards, and the buy signal is losing its relevance. Stochastic is in the neutral zone, and the lines of the oscillator are directed horizontally.
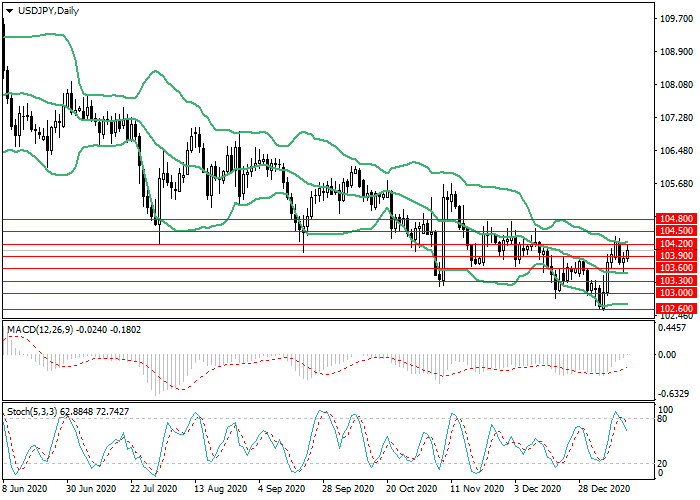
USD/JPY, D1
On the D1 chart, a lateral trend is forming. The instrument is traded in a narrow corridor formed by the lines of the Bollinger Bands, the indicator cloud is narrowed; preservation of lateral dynamics is likely in the medium term. MACD histogram is in the negative area and its volumes are minimal; the signal line is reversing upwards and the sell signal is losing its relevance. Stochastic is at the border of the neutral zone with the oversold zone; the lines of the oscillator are reversing downwards. The sell signal is forming.

Key levels
Resistance levels: 104.20, 104.50, 104.80.
Support levels: 103.90, 103.60, 103.30, 103.00, 102.60.
Trading tips
Long positions may be opened from the current level with target at 104.50. Stop-loss – 103.70. Implementation time: 1-3 days.
Short positions may be opened from the level of 103.60 with target at 103.00 and stop-loss at 103.90.


No comments:
Write comments