
BTC/USD: the pair consolidates before the Fed meeting
25 January 2021, 11:52

| Scenario | |
|---|---|
| Timeframe | Weekly |
| Recommendation | SELL STOP |
| Entry Point | 30480.00 |
| Take Profit | 28125.00, 25000.00 |
| Stop Loss | 32350.00 |
| Key Levels | 25000.00, 28125.00, 30500.00, 34375.00, 36000.00, 37500.00 |
| Alternative scenario | |
|---|---|
| Recommendation | BUY STOP |
| Entry Point | 34400.00 |
| Take Profit | 36000.00, 37500.00 |
| Stop Loss | 33000.00 |
| Key Levels | 25000.00, 28125.00, 30500.00, 34375.00, 36000.00, 37500.00 |
Current trend
At the beginning of last week, the BTC/USD pair corrected downwards again, consolidating within the range of 33000.00–31000.00.
Observers believe that there may be a shortage of institutional investment in the market. Large players who were going to buy BTC have already done this, ensuring the growth of the rate to historical highs, and now they are closing profitable positions. Also, the price was pressured by reports that an error could occur in the Bitcoin network (the so-called "double-spend", when the same BTC coin was processed in two different transactions) but these data were not confirmed.
At present, investors are waiting for the central event of the week – the US Federal Reserve, which will be the first one this year, so the price consolidated. If the regulator decides on new stimulus measures for the American economy, the instrument will receive a new impetus for growth.
Support and resistance
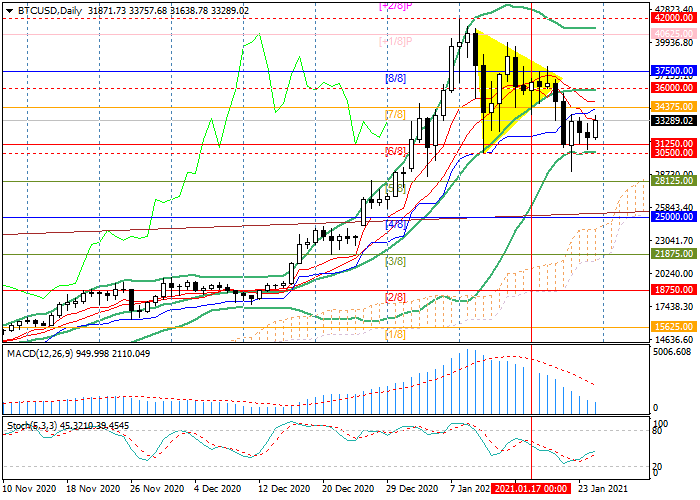
At present, the key “bullish” level is 34375.00 (Murrey [7/8]). Its breakout allows growth to 36000.00 (Bollinger bands’ midline) and 37500.00 (Murrey [8/8]). The further decline will be possible after the breakdown of the support zone 31250.00–30500.00 (Murrey [6/8], Bollinger bands’ lower line), and the price may fall to 28125.00 (Murrey [5/8]) and 25000.00 (Murrey [4/8]).
Technical indicators do not provide a single signal, illustrating market uncertainty. Bollinger Bands are directed horizontally. Stochastic is reversing upwards. The MACD histogram is declining in the positive zone.
Resistance levels: 34375.00, 36000.00, 37500.00.
Support levels: 30500.00, 28125.00, 25000.00.
Trading tips
Short positions may be opened after the consolidation below 30500.00 with the targets at 28125.00, 25000.00, and stop loss 32350.00. Implementation period: 5–7 days.
Long positions may be opened above 34375.00 with the targets at 36000.00, 37500.00, and stop loss 33000.00.


No comments:
Write comments