
BTC/USD: the growth of the pair suspended
18 January 2021, 11:05
| Scenario | |
|---|---|
| Timeframe | Weekly |
| Recommendation | BUY STOP |
| Entry Point | 37800.00 |
| Take Profit | 42000.00, 43750.00 |
| Stop Loss | 35000.00 |
| Key Levels | 28125.00, 31250.00, 34375.00, 37500.00, 42000.00, 43750.00 |
| Alternative scenario | |
|---|---|
| Recommendation | SELL STOP |
| Entry Point | 34250.00 |
| Take Profit | 31250.00, 28125.00 |
| Stop Loss | 37000.00 |
| Key Levels | 28125.00, 31250.00, 34375.00, 37500.00, 42000.00, 43750.00 |
Current trend
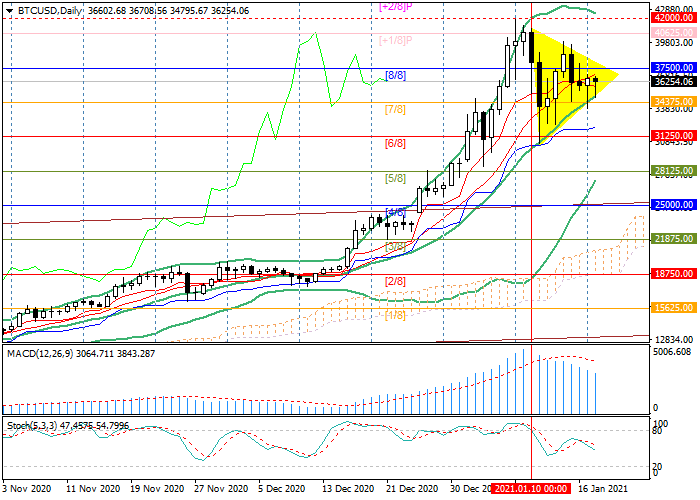
At the beginning of last week, the pair corrected sharply downwards from all-time highs (42000.00) to the level of 30600.00. Then the price recovered, but only partially, and is currently at 36000.00.
Experts linked the downward correction to the profit taking by investors, which traditionally occurs when the price reaches psychological levels important for the market, but its size (25%) can have serious negative consequences for BTC. According to the Bloomberg polls, many Wall Street executives will now be more wary of the first cryptocurrency, as they consider large fluctuations in its price unacceptable. According to JPMorgan, the share of large institutional players in the cryptocurrency market remains small, and the overall market sentiment remains speculative, which threatens with new manifestations of high volatility.
Support and resistance
The price is currently sandwiched between two important levels. The price consolidation above 37500.00 (Murrey [8/8]) and the upper border of the Triangle will give the prospect of a return of quotations to 42000.00 or reaching new highs at 43750.00 (Murrey [+2/8]). A breakdown of the 34375.00 (Murrey [7/8], the center line of Bollinger Bands) will provide a decline to 31250.00 (Murrey [6/8]) and 28125.00 (Murrey [5/8]). Technical indicators don't provide a clear signal. Bollinger Bands are directed upwards. Stochastic is reversing downwards. MACD histogram is reducing in the positive zone.
Resistance levels: 37500.00, 42000.00, 43750.00.
Support levels: 34375.00, 31250.00, 28125.00.

Trading tips
Long positions may be opened above 37500.00 with targets at 42000.00, 43750.00 and stop-loss at 35000.00. Implementation period: 5-7 days.
Short positions may be opened after the price consolidates below 34375.00 with targets at 31250.00, 28125.00 and stop-loss at 37000.00.


No comments:
Write comments