
EUR/USD: EUR is consolidating
29 June 2020, 11:55
| Scenario | |
|---|---|
| Timeframe | Intraday |
| Recommendation | BUY STOP |
| Entry Point | 1.1270 |
| Take Profit | 1.1352 |
| Stop Loss | 1.1200 |
| Key Levels | 1.1100, 1.1131, 1.1167, 1.1200, 1.1266, 1.1300, 1.1352, 1.1400 |
| Alternative scenario | |
|---|---|
| Recommendation | SELL STOP |
| Entry Point | 1.1195 |
| Take Profit | 1.1131, 1.1100 |
| Stop Loss | 1.1215 |
| Key Levels | 1.1100, 1.1131, 1.1167, 1.1200, 1.1266, 1.1300, 1.1352, 1.1400 |
Current trend
EUR is showing moderate growth against USD during today’s Asian session, correcting after the “bearish” close of trading last week. The downtrend in the instrument was facilitated by the growth of correctional sentiment, while fundamentally the situation on the market changes little. EUR is recovering against expectations of the growth of the European economy; however, the outbreaks of disease that are recorded in various countries of the world again suggest the second wave of the epidemic, which can significantly affect the recovery of the global economy.
Today, European investors are focused on the publication of statistics on business sentiment in the eurozone in June. Traders also expect the release of data on consumer inflation in Germany in June. Consumer inflation in Germany is projected to rise by 0.3 MoM after falling 0.1% MoM last month.
Support and resistance
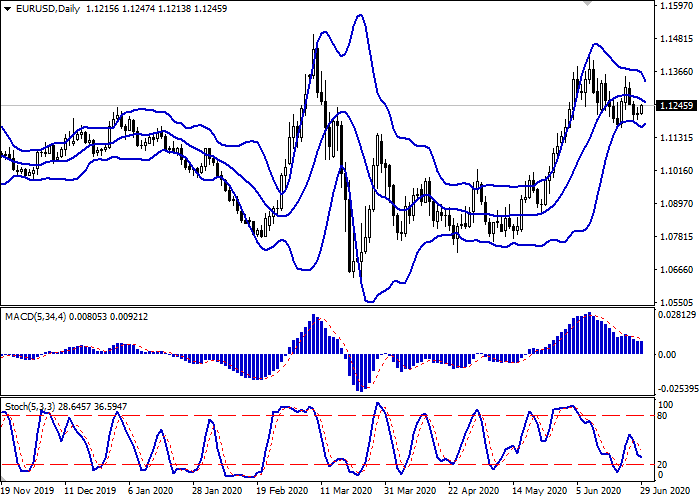
Bollinger Bands in D1 chart demonstrate a gradual decrease. The price range is narrowing actively, reflecting the emergence of ambiguous dynamics of trading in the ultra-short term. MACD is going down keeping a fairly stable sell signal (located below the signal line). Stochastic, after a short growth at the beginning of the last trading week, reversed downwards again and is located near the level of “20”.
Technical indicators do not contradict the further development of the downtrend in the short and/or ultra-short term.
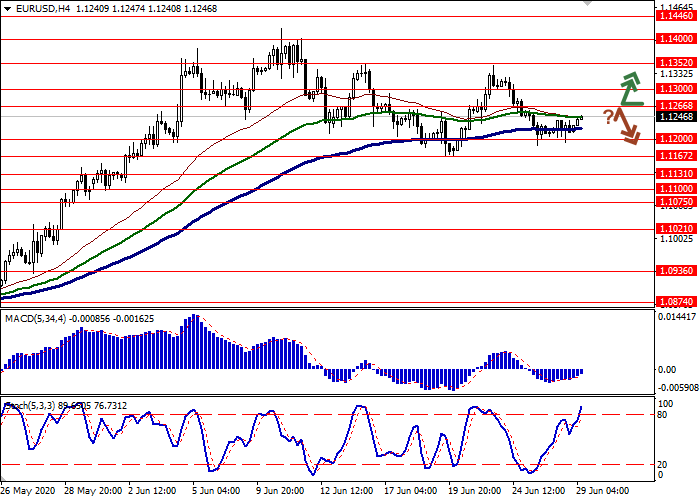
Resistance levels: 1.1266, 1.1300, 1.1352, 1.1400.
Support levels: 1.1200, 1.1167, 1.1131, 1.1100.
Trading tips
To open long positions, one can rely on the breakout of 1.1266. Take-profit – 1.1352. Stop-loss – 1.1200. Implementation time: 1-2 days.
A rebound from 1.1266 as from resistance, followed by a breakdown of 1.1200 may become a signal for new sales with the targets at 1.1131–1.1100. Stop-loss should be placed no further than 1.1266. Implementation time: 2-3 days.
EUR is showing moderate growth against USD during today’s Asian session, correcting after the “bearish” close of trading last week. The downtrend in the instrument was facilitated by the growth of correctional sentiment, while fundamentally the situation on the market changes little. EUR is recovering against expectations of the growth of the European economy; however, the outbreaks of disease that are recorded in various countries of the world again suggest the second wave of the epidemic, which can significantly affect the recovery of the global economy.
Today, European investors are focused on the publication of statistics on business sentiment in the eurozone in June. Traders also expect the release of data on consumer inflation in Germany in June. Consumer inflation in Germany is projected to rise by 0.3 MoM after falling 0.1% MoM last month.
Support and resistance
Bollinger Bands in D1 chart demonstrate a gradual decrease. The price range is narrowing actively, reflecting the emergence of ambiguous dynamics of trading in the ultra-short term. MACD is going down keeping a fairly stable sell signal (located below the signal line). Stochastic, after a short growth at the beginning of the last trading week, reversed downwards again and is located near the level of “20”.
Technical indicators do not contradict the further development of the downtrend in the short and/or ultra-short term.
Resistance levels: 1.1266, 1.1300, 1.1352, 1.1400.
Support levels: 1.1200, 1.1167, 1.1131, 1.1100.
Trading tips
To open long positions, one can rely on the breakout of 1.1266. Take-profit – 1.1352. Stop-loss – 1.1200. Implementation time: 1-2 days.
A rebound from 1.1266 as from resistance, followed by a breakdown of 1.1200 may become a signal for new sales with the targets at 1.1131–1.1100. Stop-loss should be placed no further than 1.1266. Implementation time: 2-3 days.


No comments:
Write comments