
AUD/USD: the instrument is consolidating
10 June 2020, 10:35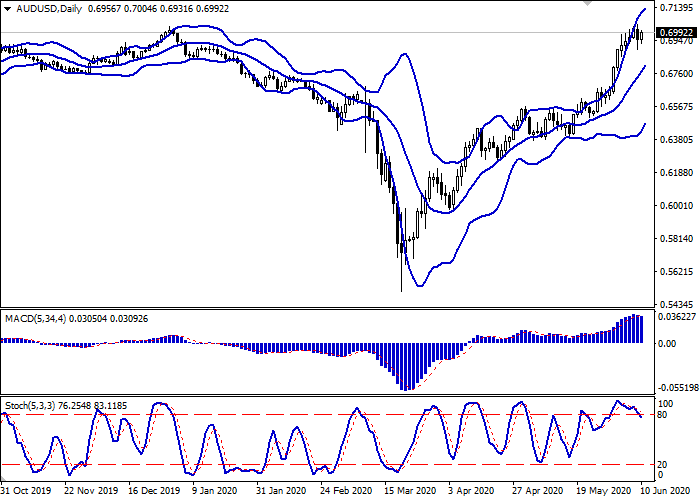
| Scenario | |
|---|---|
| Timeframe | Intraday |
| Recommendation | BUY STOP |
| Entry Point | 0.7045 |
| Take Profit | 0.7150 |
| Stop Loss | 0.6990 |
| Key Levels | 0.6812, 0.6856, 0.6900, 0.6955, 0.7000, 0.7041, 0.7100 |
| Alternative scenario | |
|---|---|
| Recommendation | SELL STOP |
| Entry Point | 0.6950 |
| Take Profit | 0.6856, 0.6812 |
| Stop Loss | 0.7041 |
| Key Levels | 0.6812, 0.6856, 0.6900, 0.6955, 0.7000, 0.7041, 0.7100 |
Current trend
AUD is showing moderate growth against USD during today's Asian session, recovering after a corrective decline the day before. The instrument adds about 0.50% and is actively testing the level of 0.7000 for a breakout. AUD is supported by rather weak positions in USD, which is again retreating across the entire spectrum of the market after an unsuccessful growth attempt on Tuesday.
In turn, macroeconomic statistics from Australia and China hinder the more active growth of the instrument. Home Loans in Australia in April fell by 4.4% after a decrease of 0.1% in March. Analysts had expected zero dynamics. Chinese data reflected a sharp decline in consumer inflation in May. Consumer price index slowed down from 3.3% YoY to 2.4% YoY, which turned out to be worse than the forecast of 2.7% YoY.
Support and resistance
Bollinger Bands in D1 chart show stable growth. The price range is narrowing from below, reflecting the emergence of ambiguous dynamics of trading in the short term. MACD is reversing downwards forming a new sell signal (located below the signal line). Stochastic also maintains a moderate downtrend, retreating from its highs, indicating the risks of overbought AUD in the ultra-short term.
The development of a full-fledged downtrend is possible in the short and/or ultra-short term.
Resistance levels: 0.7000, 0.7041, 0.7100.
Support levels: 0.6955, 0.6900, 0.6856, 0.6812.

Trading tips
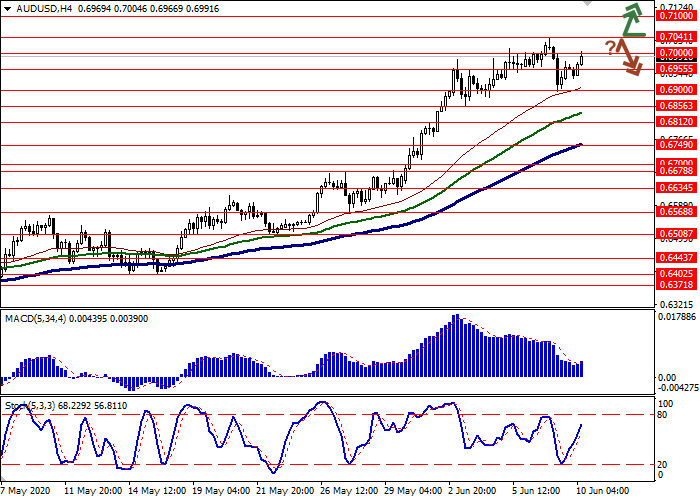
To open long positions, one can rely on the breakout of 0.7041. Take-profit – 0.7150. Stop-loss – 0.6990. Implementation time: 1-2 days.
A rebound from 0.7041 as from resistance, followed by a breakdown of 0.6955 may become a signal for new sales with the targets at 0.6856–0.6812. Stop-loss – 0.7041. Implementation time: 2-3 days.
AUD is showing moderate growth against USD during today's Asian session, recovering after a corrective decline the day before. The instrument adds about 0.50% and is actively testing the level of 0.7000 for a breakout. AUD is supported by rather weak positions in USD, which is again retreating across the entire spectrum of the market after an unsuccessful growth attempt on Tuesday.
In turn, macroeconomic statistics from Australia and China hinder the more active growth of the instrument. Home Loans in Australia in April fell by 4.4% after a decrease of 0.1% in March. Analysts had expected zero dynamics. Chinese data reflected a sharp decline in consumer inflation in May. Consumer price index slowed down from 3.3% YoY to 2.4% YoY, which turned out to be worse than the forecast of 2.7% YoY.
Support and resistance
Bollinger Bands in D1 chart show stable growth. The price range is narrowing from below, reflecting the emergence of ambiguous dynamics of trading in the short term. MACD is reversing downwards forming a new sell signal (located below the signal line). Stochastic also maintains a moderate downtrend, retreating from its highs, indicating the risks of overbought AUD in the ultra-short term.
The development of a full-fledged downtrend is possible in the short and/or ultra-short term.
Resistance levels: 0.7000, 0.7041, 0.7100.
Support levels: 0.6955, 0.6900, 0.6856, 0.6812.
Trading tips
To open long positions, one can rely on the breakout of 0.7041. Take-profit – 0.7150. Stop-loss – 0.6990. Implementation time: 1-2 days.
A rebound from 0.7041 as from resistance, followed by a breakdown of 0.6955 may become a signal for new sales with the targets at 0.6856–0.6812. Stop-loss – 0.7041. Implementation time: 2-3 days.


No comments:
Write comments