Brent Crude Oil: oil remains under pressure
09 August 2019, 09:58
| Scenario | |
|---|---|
| Timeframe | Intraday |
| Recommendation | BUY STOP |
| Entry Point | 58.20 |
| Take Profit | 60.64, 61.51 |
| Stop Loss | 57.00 |
| Key Levels | 55.00, 55.33, 55.88, 56.77, 58.17, 59.16, 60.00, 60.64 |
| Alternative scenario | |
|---|---|
| Recommendation | SELL STOP |
| Entry Point | 56.70 |
| Take Profit | 55.00 |
| Stop Loss | 57.70 |
| Key Levels | 55.00, 55.33, 55.88, 56.77, 58.17, 59.16, 60.00, 60.64 |
Current trend
Oil quotes rose slightly on Thursday, receiving support from the expectation of a decrease in production volumes amid a prolonged decline in prices. In addition, the instrument was supported by strong macroeconomic statistics from China, which signals a slight improvement in global demand, despite growing pressure from the US. The market also reacted positively to statements by Saudi Arabia, which, in addition to the current OPEC+ agreement, calls on all oil exporters to discuss an additional reduction in prices in order to maintain a balance of supply and demand in the market. Today, investors are waiting for Baker Hughes US Oil Rig Count report.
Support and resistance
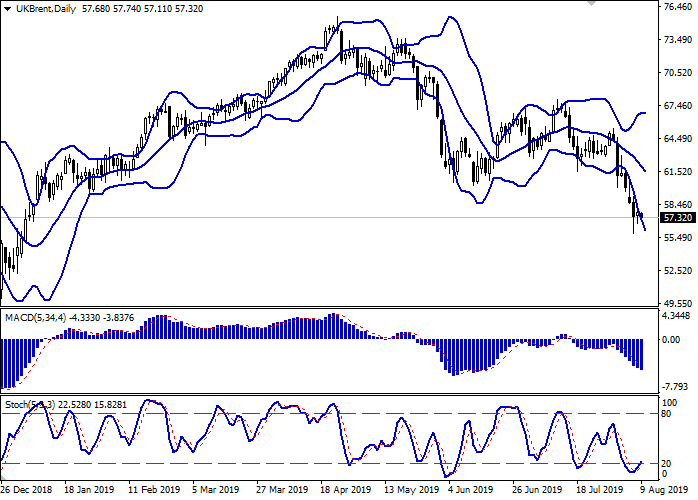
Bollinger Bands in D1 chart demonstrate a stable decrease. The price range is expanding, hardly conforming to the "bearish" trend development. MACD is going down keeping a moderate sell signal (located below the signal line). Stochastic reaching its lows gradually reverses upwards, pointing at the risks of corrective growth in the short or ultra-short term.
One can consider the possibility of opening new long positions in the short and/or ultra-short term, if the signals of technical indicators do not contradict this.
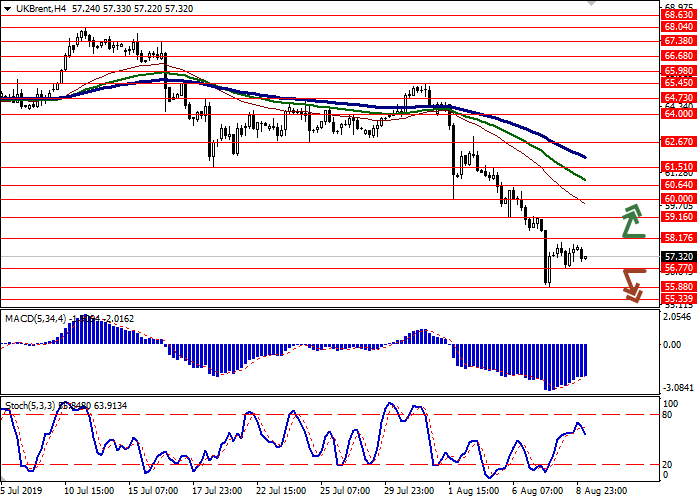
Resistance levels: 58.17, 59.16, 60.00, 60.64.
Support levels: 56.77, 55.88, 55.33, 55.00.


Trading tips
To open long positions, one can rely on the breakout of 58.17. Take profit — 60.64 or 61.51. Stop loss — 57.00. Implementation time: 2-3 days.
The breakdown of 56.77 may serve as a signal to new sales with the target at 55.00. Stop loss — 57.70. Implementation time: 1-2 days.
Oil quotes rose slightly on Thursday, receiving support from the expectation of a decrease in production volumes amid a prolonged decline in prices. In addition, the instrument was supported by strong macroeconomic statistics from China, which signals a slight improvement in global demand, despite growing pressure from the US. The market also reacted positively to statements by Saudi Arabia, which, in addition to the current OPEC+ agreement, calls on all oil exporters to discuss an additional reduction in prices in order to maintain a balance of supply and demand in the market. Today, investors are waiting for Baker Hughes US Oil Rig Count report.
Support and resistance
Bollinger Bands in D1 chart demonstrate a stable decrease. The price range is expanding, hardly conforming to the "bearish" trend development. MACD is going down keeping a moderate sell signal (located below the signal line). Stochastic reaching its lows gradually reverses upwards, pointing at the risks of corrective growth in the short or ultra-short term.
One can consider the possibility of opening new long positions in the short and/or ultra-short term, if the signals of technical indicators do not contradict this.
Resistance levels: 58.17, 59.16, 60.00, 60.64.
Support levels: 56.77, 55.88, 55.33, 55.00.


Trading tips
To open long positions, one can rely on the breakout of 58.17. Take profit — 60.64 or 61.51. Stop loss — 57.00. Implementation time: 2-3 days.
The breakdown of 56.77 may serve as a signal to new sales with the target at 55.00. Stop loss — 57.70. Implementation time: 1-2 days.


No comments:
Write comments