
USD/CHF: ambiguous dynamics
19 July 2019, 09:42
| Scenario | |
|---|---|
| Timeframe | Intraday |
| Recommendation | BUY STOP |
| Entry Point | 0.9865 |
| Take Profit | 0.9930, 0.9960 |
| Stop Loss | 0.9833, 0.9820 |
| Key Levels | 0.9692, 0.9737, 0.9775, 0.9800, 0.9833, 0.9860, 0.9907, 0.9930 |
| Alternative scenario | |
|---|---|
| Recommendation | SELL STOP |
| Entry Point | 0.9795 |
| Take Profit | 0.9737, 0.9710, 0.9700 |
| Stop Loss | 0.9833 |
| Key Levels | 0.9692, 0.9737, 0.9775, 0.9800, 0.9833, 0.9860, 0.9907, 0.9930 |
Current trend
Yesterday, the USD/CHF pair dropped sharply, renewing the lows since July 1. USD is under pressure of disappointing news that the process of negotiations between the United States and China were at an impasse. In addition, investors respond to the housing market data, which were significantly worse than market expectations. The negative of this indicator can offset the positive effect of the recent growth in US retail sales, which may lead to the Fed's monetary policy easing in July.
Thursday’s Swiss data moderately supported CHF. June’s Exports increased by 2.0454 billion after an increase by 21.538 billion CHF in May. Analysts had expected a sharp decline in exports to 538 million. Over the same period, Imports growth slowed down from 18.140 to 1.6359 million CHF, which led to an increase in the trade surplus in June from 3.398 to 4.096 million CHF.
Support and resistance
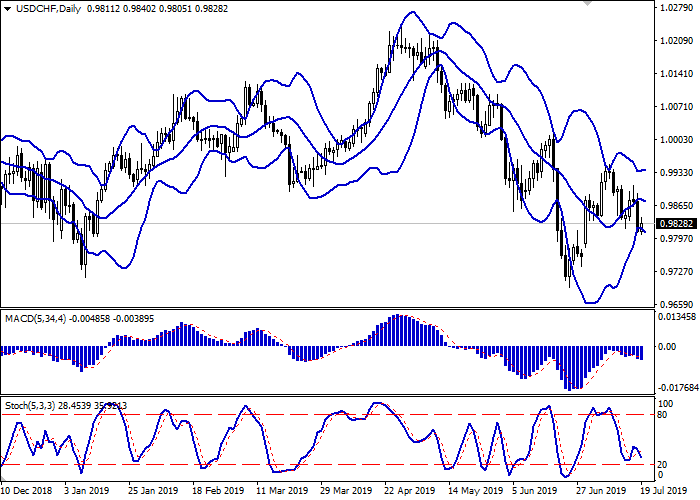
On the daily chart, Bollinger bands moderately reduced. The price range slightly expands but not as fast as the "bearish" trend develops. The MACD falls, keeping a poor sell signal (the histogram is below the signal line). After a brief increase, Stochastic reversed to a downward plane and is nearing its lows, signaling than USD may become oversold in the super-short term.
The current readings of the indicators do not contradict the further development of the downward trend in the short and/or super short term.
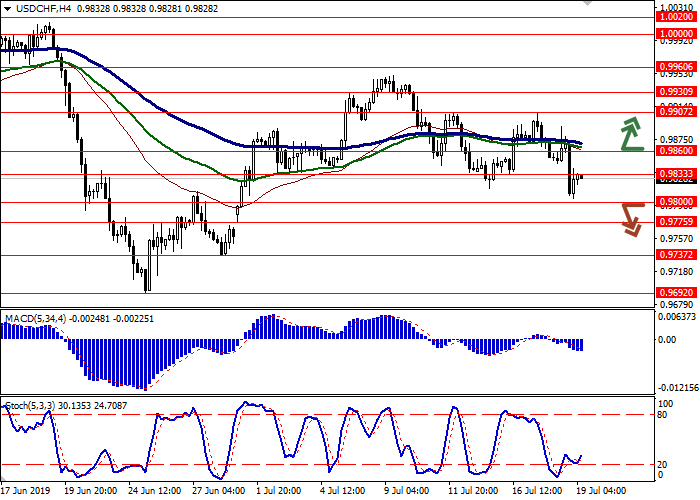
Resistance levels: 0.9833, 0.9860, 0.9907, 0.9930.
Support levels: 0.9800, 0.9775, 0.9737, 0.9692.
Trading tips
Long positions can be opened after the breakout of 0.9860 with the target at 0.9930 or 0.9960. Stop loss is 0.9833–0.9820.
Short positions can be opened after the breakdown of 0.9800 with the targets at 0.9737 or 0.9710–0.9700. Stop loss is 0.9833.
Implementation period: 2-3 days.
Yesterday, the USD/CHF pair dropped sharply, renewing the lows since July 1. USD is under pressure of disappointing news that the process of negotiations between the United States and China were at an impasse. In addition, investors respond to the housing market data, which were significantly worse than market expectations. The negative of this indicator can offset the positive effect of the recent growth in US retail sales, which may lead to the Fed's monetary policy easing in July.
Thursday’s Swiss data moderately supported CHF. June’s Exports increased by 2.0454 billion after an increase by 21.538 billion CHF in May. Analysts had expected a sharp decline in exports to 538 million. Over the same period, Imports growth slowed down from 18.140 to 1.6359 million CHF, which led to an increase in the trade surplus in June from 3.398 to 4.096 million CHF.
Support and resistance
On the daily chart, Bollinger bands moderately reduced. The price range slightly expands but not as fast as the "bearish" trend develops. The MACD falls, keeping a poor sell signal (the histogram is below the signal line). After a brief increase, Stochastic reversed to a downward plane and is nearing its lows, signaling than USD may become oversold in the super-short term.
The current readings of the indicators do not contradict the further development of the downward trend in the short and/or super short term.
Resistance levels: 0.9833, 0.9860, 0.9907, 0.9930.
Support levels: 0.9800, 0.9775, 0.9737, 0.9692.
Trading tips
Long positions can be opened after the breakout of 0.9860 with the target at 0.9930 or 0.9960. Stop loss is 0.9833–0.9820.
Short positions can be opened after the breakdown of 0.9800 with the targets at 0.9737 or 0.9710–0.9700. Stop loss is 0.9833.
Implementation period: 2-3 days.


No comments:
Write comments