
Brent Crude Oil: oil prices are dropping
19 July 2019, 09:39
| Scenario | |
|---|---|
| Timeframe | Intraday |
| Recommendation | BUY STOP |
| Entry Point | 64.05 |
| Take Profit | 65.98, 66.68 |
| Stop Loss | 63.00 |
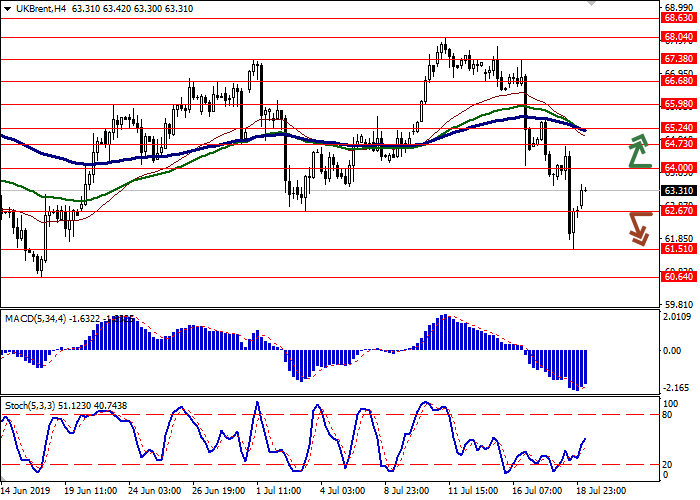
| Key Levels | 60.64, 61.51, 62.67, 64.00, 64.73, 65.24, 65.98 |
| Alternative scenario | |
|---|---|
| Recommendation | SELL STOP |
| Entry Point | 62.60 |
| Take Profit | 60.64, 60.00 |
| Stop Loss | 63.50 |
| Key Levels | 60.64, 61.51, 62.67, 64.00, 64.73, 65.24, 65.98 |
Current trend
Oil prices showed ambiguous trend on July 18, updating monthly local minima. Quotes began to fall amid a sharp decline in US stock exchanges, as well as due to expectations of a quick recovery in production in the Gulf of Mexico after the hurricane last week. The instrument is also pressured by a previously published report from the EIA, which indicated a decrease in crude oil reserves, but also reflected a sharp increase in gasoline and distillate stocks. Investors are also reacting negatively to deadlocked US-China trade negotiations. Apparently, the situation will not change as long as the US authorities do not ease the sanctions on the Chinese company Huawei. On Friday, a Baker Hughes report on active oil rigs in the US is expected.
Support and resistance
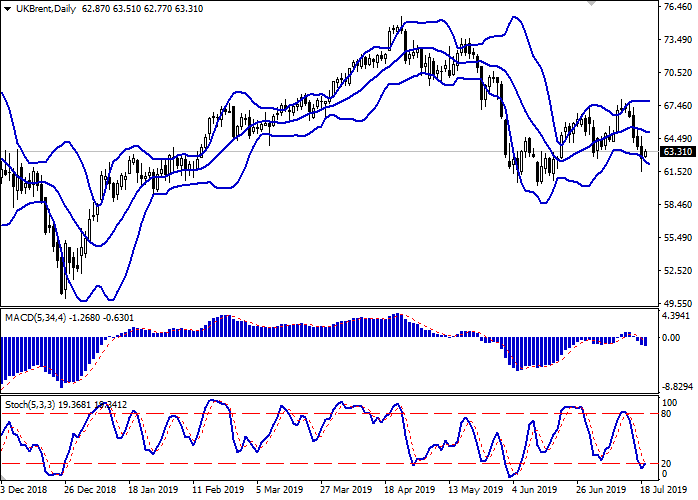
On the D1 chart, Bollinger Bands are reversing horizontally. The price range narrows, reflecting the predominance of "bearish" sentiment in the short term. MACD is going down preserving a moderate sell signal (being located under the signal line). Stochastic, after testing the level of 20, is trying to show an upward reversal, indicating the oversold instrument in the ultra-short term.
There's a possibility of a correctional growth in the short and/or ultra-short term.
Resistance levels: 64.00, 64.73, 65.24, 65.98.
Support levels: 62.67, 61.51, 60.64.
Trading tips
To open long positions, one can rely on the breakout of 64.00. Take profit – 65.98 or 66.68. Stop loss – 63.00.
The return of "bearish" dynamics with the breakdown of 62.67 may become a signal to start sales with the target at 60.64–60.00. Stop loss – 63.50.
Implementation period: 2-3 days.
Oil prices showed ambiguous trend on July 18, updating monthly local minima. Quotes began to fall amid a sharp decline in US stock exchanges, as well as due to expectations of a quick recovery in production in the Gulf of Mexico after the hurricane last week. The instrument is also pressured by a previously published report from the EIA, which indicated a decrease in crude oil reserves, but also reflected a sharp increase in gasoline and distillate stocks. Investors are also reacting negatively to deadlocked US-China trade negotiations. Apparently, the situation will not change as long as the US authorities do not ease the sanctions on the Chinese company Huawei. On Friday, a Baker Hughes report on active oil rigs in the US is expected.
Support and resistance
On the D1 chart, Bollinger Bands are reversing horizontally. The price range narrows, reflecting the predominance of "bearish" sentiment in the short term. MACD is going down preserving a moderate sell signal (being located under the signal line). Stochastic, after testing the level of 20, is trying to show an upward reversal, indicating the oversold instrument in the ultra-short term.
There's a possibility of a correctional growth in the short and/or ultra-short term.
Resistance levels: 64.00, 64.73, 65.24, 65.98.
Support levels: 62.67, 61.51, 60.64.
Trading tips
To open long positions, one can rely on the breakout of 64.00. Take profit – 65.98 or 66.68. Stop loss – 63.00.
The return of "bearish" dynamics with the breakdown of 62.67 may become a signal to start sales with the target at 60.64–60.00. Stop loss – 63.50.
Implementation period: 2-3 days.


No comments:
Write comments