
Brent Crude Oil: general review
17 July 2019, 12:56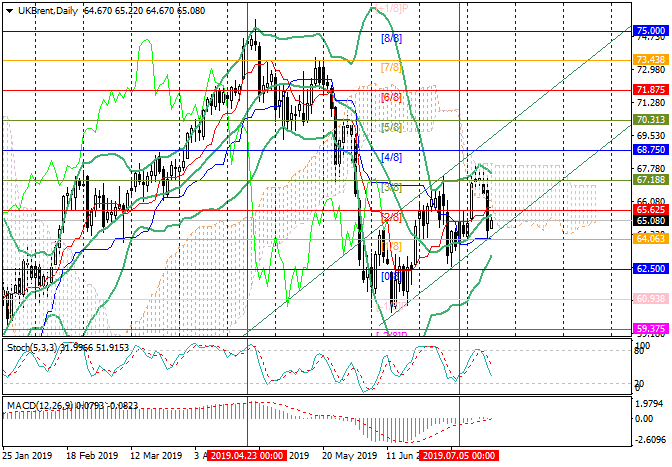
| Scenario | |
|---|---|
| Timeframe | Weekly |
| Recommendation | BUY STOP |
| Entry Point | 65.65 |
| Take Profit | 67.18, 68.75 |
| Stop Loss | 64.80 |
| Key Levels | 60.93, 62.50, 64.06, 65.62, 67.18, 68.75 |
| Alternative scenario | |
|---|---|
| Recommendation | SELL STOP |
| Entry Point | 64.06 |
| Take Profit | 62.50, 60.93 |
| Stop Loss | 64.60 |
| Key Levels | 60.93, 62.50, 64.06, 65.62, 67.18, 68.75 |
Current trend
Yesterday, Brent crude oil dropped sharply amid comments by US Secretary of State Michael Pompeo and President Donald Trump on improving the situation in Iran.
Investors' hope for easing tensions in the Middle East lowered quotes to 64.10. However, today they started to recover. Iranian Foreign Minister of the Islamic Republic, Mohammad Javad Zarif, said that negotiations would become possible only if the sanctions were lifted and the supply of American weapons to the region was stopped. Quotes are also supported by API report, according to which oil reserves in the US declined for the fifth consecutive month, this time by 1.401 million barrels. Gasoline stocks declined by 0.476 million, and stocks of distillates grew by 6.230 million barrels. Today, the market is waiting for the weekly EIA report. The indicator is expected to decline by 2.694 million barrels, which may support prices.
Support and resistance
The instrument attempts to reverse from the lower border of the ascending channel. After the breakout of 65.62 (Murrey [2/8], the midline of Bollinger Bands), the price may reach 67.18 (Murrey [3/8]) and 68.75 (Murrey [4/8]). The level of 64.06 (Murrey [1/8]) is the key for the "bears". If the price consolidates below it, a decline will be possible to 62.50 (Murrey [0/8]) and 60.93 (Murrey [-1/8]).
Technical indicators don't provide a clear signal: Bollinger Bands are directed upwards, Stochastic is pointing downwards. MACD histogram has moved to the positive zone, but its volume is insignificant.
Resistance levels: 65.62, 67.18, 68.75.
Support levels: 64.06, 62.50, 60.93.

Trading tips
Long positions may be opened above 65.62 with targets at 67.18, 68.75 and stop loss at 64.80.
Short positions may be opened below 64.06 with targets at 62.50, 60.93 and stop loss at 64.60.
Implementation period: 4-5 days.
Yesterday, Brent crude oil dropped sharply amid comments by US Secretary of State Michael Pompeo and President Donald Trump on improving the situation in Iran.
Investors' hope for easing tensions in the Middle East lowered quotes to 64.10. However, today they started to recover. Iranian Foreign Minister of the Islamic Republic, Mohammad Javad Zarif, said that negotiations would become possible only if the sanctions were lifted and the supply of American weapons to the region was stopped. Quotes are also supported by API report, according to which oil reserves in the US declined for the fifth consecutive month, this time by 1.401 million barrels. Gasoline stocks declined by 0.476 million, and stocks of distillates grew by 6.230 million barrels. Today, the market is waiting for the weekly EIA report. The indicator is expected to decline by 2.694 million barrels, which may support prices.
Support and resistance
The instrument attempts to reverse from the lower border of the ascending channel. After the breakout of 65.62 (Murrey [2/8], the midline of Bollinger Bands), the price may reach 67.18 (Murrey [3/8]) and 68.75 (Murrey [4/8]). The level of 64.06 (Murrey [1/8]) is the key for the "bears". If the price consolidates below it, a decline will be possible to 62.50 (Murrey [0/8]) and 60.93 (Murrey [-1/8]).
Technical indicators don't provide a clear signal: Bollinger Bands are directed upwards, Stochastic is pointing downwards. MACD histogram has moved to the positive zone, but its volume is insignificant.
Resistance levels: 65.62, 67.18, 68.75.
Support levels: 64.06, 62.50, 60.93.
Trading tips
Long positions may be opened above 65.62 with targets at 67.18, 68.75 and stop loss at 64.80.
Short positions may be opened below 64.06 with targets at 62.50, 60.93 and stop loss at 64.60.
Implementation period: 4-5 days.


No comments:
Write comments