AUD/USD: general review
03 July 2019, 09:40
| Scenario | |
|---|---|
| Timeframe | Intraday |
| Recommendation | BUY STOP |
| Entry Point | 0.7005 |
| Take Profit | 0.7033, 0.7050 |
| Stop Loss | 0.6980, 0.6975 |
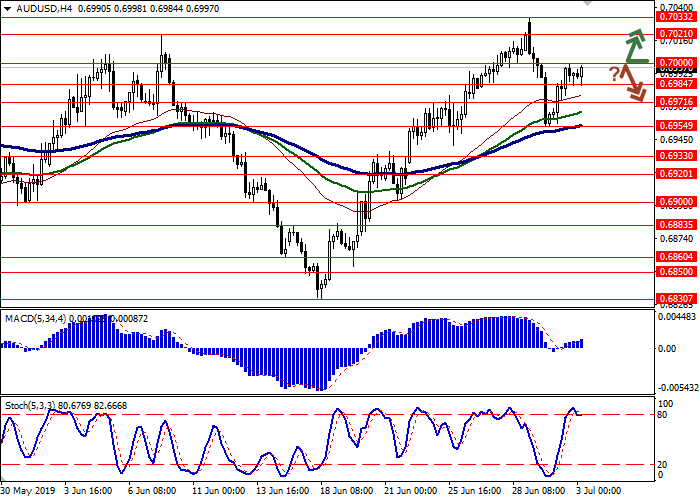
| Key Levels | 0.6933, 0.6954, 0.6971, 0.6984, 0.7000, 0.7021, 0.7033 |
| Alternative scenario | |
|---|---|
| Recommendation | SELL STOP |
| Entry Point | 0.6980, 0.6965 |
| Take Profit | 0.6933, 0.6920 |
| Stop Loss | 0.7000 |
| Key Levels | 0.6933, 0.6954, 0.6971, 0.6984, 0.7000, 0.7021, 0.7033 |
Current trend
AUD rose against USD yesterday, having won back part of the losses suffered at the beginning of the week. Curiously, the growth of the instrument proceeded amid the expected RBA decision to reduce the interest rate from 1.25% to 1.00%. The head of the regulator Philip Lowe noted that additional measures of stimulation may be taken if the economic situation continues to deteriorate.
Today, the pair is trading in both directions. The AiG Services PMI in June fell from 52.5 to 52.2 points. The number of issued construction permits in May grew by 0.7% MoM after a decrease of 3.4% last month. Analysts were expecting zero dynamics. Exports in May rose sharply by 4.0% MoM, accelerating from 1.6% in April. In contrast, imports slowed down from 2.3% to 2.0% MoM, which led to a stronger increase in the trade surplus from 4.820 million to 5.745 million AUD.
Support and resistance
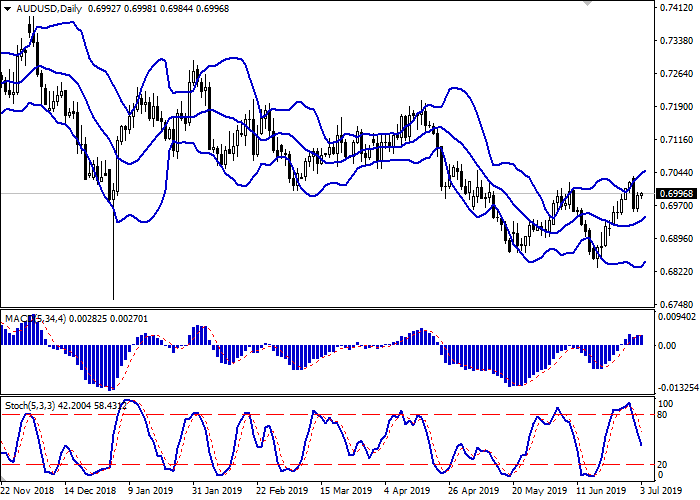
Bollinger Bands in D1 chart show moderate growth. The price range is slightly narrowed from below, remaining rather spacious, given the current level of activity in the market. MACD indicator is growing preserving a weak buy signal (histogram is above the signal line). Stochastic is still falling and almost doesn’t react to the resumption of growth on July 2.
To open new positions, one should wait for the clarification of signals from technical indicators.
Resistance levels: 0.7000, 0.7021, 0.7033.
Support levels: 0.6984, 0.6971, 0.6954, 0.6933.


Trading tips
To open long positions, one can rely on the breakout of 0.7000. Take-profit – 0.7033–0.7050. Stop loss – 0.6980–0.6975. Implementation period: 1-2 days.
A rebound from 0.7000, as from resistance, followed by a breakdown of 0.6984–0.6971, may become a signal for corrective sales with the target at 0.6933–0.6920. Stop loss – 0.7000. Implementation period: 2-3 days.
AUD rose against USD yesterday, having won back part of the losses suffered at the beginning of the week. Curiously, the growth of the instrument proceeded amid the expected RBA decision to reduce the interest rate from 1.25% to 1.00%. The head of the regulator Philip Lowe noted that additional measures of stimulation may be taken if the economic situation continues to deteriorate.
Today, the pair is trading in both directions. The AiG Services PMI in June fell from 52.5 to 52.2 points. The number of issued construction permits in May grew by 0.7% MoM after a decrease of 3.4% last month. Analysts were expecting zero dynamics. Exports in May rose sharply by 4.0% MoM, accelerating from 1.6% in April. In contrast, imports slowed down from 2.3% to 2.0% MoM, which led to a stronger increase in the trade surplus from 4.820 million to 5.745 million AUD.
Support and resistance
Bollinger Bands in D1 chart show moderate growth. The price range is slightly narrowed from below, remaining rather spacious, given the current level of activity in the market. MACD indicator is growing preserving a weak buy signal (histogram is above the signal line). Stochastic is still falling and almost doesn’t react to the resumption of growth on July 2.
To open new positions, one should wait for the clarification of signals from technical indicators.
Resistance levels: 0.7000, 0.7021, 0.7033.
Support levels: 0.6984, 0.6971, 0.6954, 0.6933.


Trading tips
To open long positions, one can rely on the breakout of 0.7000. Take-profit – 0.7033–0.7050. Stop loss – 0.6980–0.6975. Implementation period: 1-2 days.
A rebound from 0.7000, as from resistance, followed by a breakdown of 0.6984–0.6971, may become a signal for corrective sales with the target at 0.6933–0.6920. Stop loss – 0.7000. Implementation period: 2-3 days.


No comments:
Write comments