USD/CAD: general review
20 June 2019, 13:10
| Scenario | |
|---|---|
| Timeframe | Weekly |
| Recommendation | BUY |
| Entry Point | 1.3204 |
| Take Profit | 1.3555 |
| Stop Loss | 1.3090 |
| Key Levels | 1.2460, 1.2775, 1.3955, 1.3070, 1.3150, 1.3215, 1.3335, 1.3390, 1.3555, 1.3665, 1.3800 |
Current trend
The sloping upward trend, which lasted more than three months, was replaced by a rapid fall on a weak fundamental background.
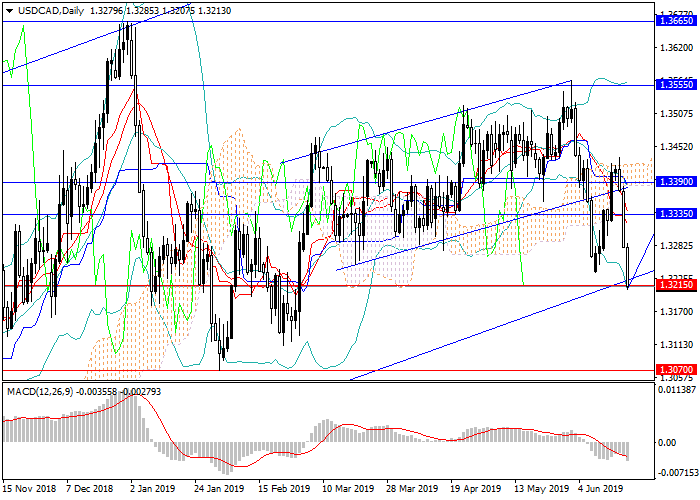
Last week, weak US releases on inflation, major indices, and the labor market were published, putting pressure on the pair. Favorable data on industrial production gave support to the instrument, but then the downward impulse strengthened. This was due to the growth of expectations of easing of the Fed monetary policy in the short term. Now the pair is trading at the lower border of the long-term ascending channel. CAD is strengthening thanks to data on inflation and the construction sector.
On Friday, special attention should be paid to data on retail sales in Canada and a number of presentations by the FOMC members.
Support and resistance
Strong data from Canada and falling demand for the US dollar may put additional pressure on the pair, which may entail a breakdown of the lower border of the channel. In this case, the instrument can fall quite strongly due to USD sales and the growth in demand for CAD. Now the price has reached 1.3215 (the upper border of the Ichimoku "cloud"). In case of taking this level, a further significant decrease to 1.2955, 1.2775, 1.2460 is possible. However, until consolidation below the level of 1.3215, the main scenario remains movement within the long-term ascending channel with targets at 1.3390, 1.3555, 1.3665, 1.3800.
MACD on the W1 chart and above confirms further growth, indicating that the high volume of long positions, while Bollinger Bands are directed upwards.
Support levels: 1.3215, 1.3150, 1.3070, 1.3955, 1.2775, 1.2460.
Resistance levels: 1.3335, 1.3390, 1.3555, 1.3665, 1.3800.

Trading tips
Long positions may be opened from the current level with target at 1.3555 and stop loss at 1.3090.
The sloping upward trend, which lasted more than three months, was replaced by a rapid fall on a weak fundamental background.
Last week, weak US releases on inflation, major indices, and the labor market were published, putting pressure on the pair. Favorable data on industrial production gave support to the instrument, but then the downward impulse strengthened. This was due to the growth of expectations of easing of the Fed monetary policy in the short term. Now the pair is trading at the lower border of the long-term ascending channel. CAD is strengthening thanks to data on inflation and the construction sector.
On Friday, special attention should be paid to data on retail sales in Canada and a number of presentations by the FOMC members.
Support and resistance
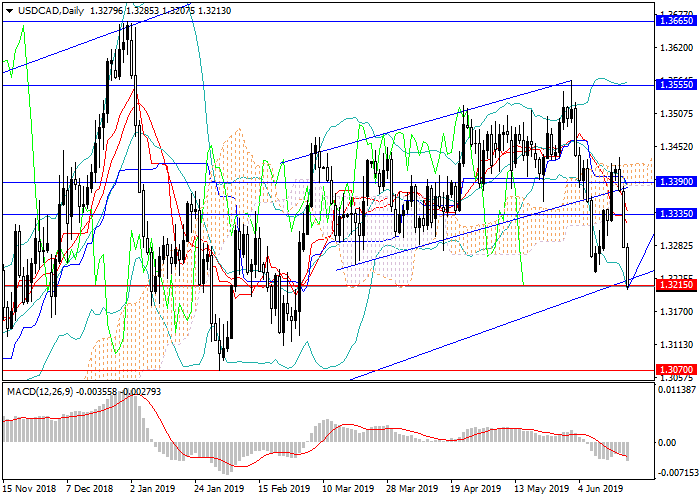
Strong data from Canada and falling demand for the US dollar may put additional pressure on the pair, which may entail a breakdown of the lower border of the channel. In this case, the instrument can fall quite strongly due to USD sales and the growth in demand for CAD. Now the price has reached 1.3215 (the upper border of the Ichimoku "cloud"). In case of taking this level, a further significant decrease to 1.2955, 1.2775, 1.2460 is possible. However, until consolidation below the level of 1.3215, the main scenario remains movement within the long-term ascending channel with targets at 1.3390, 1.3555, 1.3665, 1.3800.
MACD on the W1 chart and above confirms further growth, indicating that the high volume of long positions, while Bollinger Bands are directed upwards.
Support levels: 1.3215, 1.3150, 1.3070, 1.3955, 1.2775, 1.2460.
Resistance levels: 1.3335, 1.3390, 1.3555, 1.3665, 1.3800.

Trading tips
Long positions may be opened from the current level with target at 1.3555 and stop loss at 1.3090.


No comments:
Write comments