
Brent Crude Oil: oil prices are growing
10 June 2019, 10:01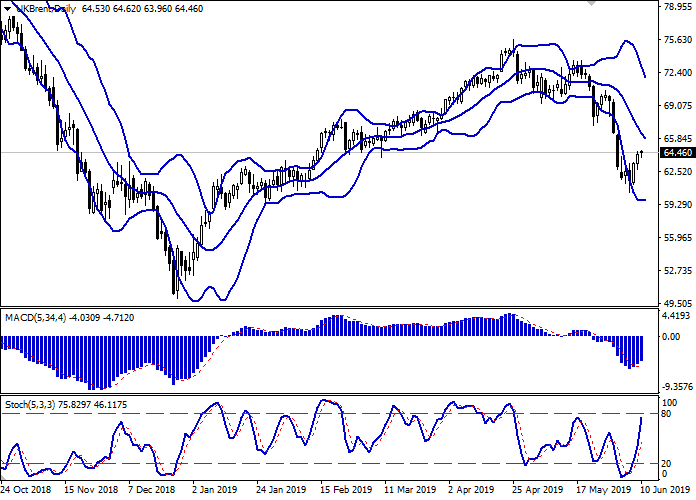
| Scenario | |
|---|---|
| Timeframe | Intraday |
| Recommendation | BUY STOP |
| Entry Point | 65.05 |
| Take Profit | 67.70, 68.63 |
| Stop Loss | 63.50, 63.08 |
| Key Levels | 60.51, 61.81, 63.08, 64.02, 65.00, 66.06, 67.00, 67.70 |
| Alternative scenario | |
|---|---|
| Recommendation | SELL STOP |
| Entry Point | 63.95 |
| Take Profit | 60.51, 60.00 |
| Stop Loss | 65.20 |
| Key Levels | 60.51, 61.81, 63.08, 64.02, 65.00, 66.06, 67.00, 67.70 |
Current trend
Oil prices recovered significantly at the end of last week, departing from local lows of January 29, updated on June 5. The quotes are supported by positive comments by the Minister of Energy of Saudi Arabia, Khalid Al-Falih, who said that Riyadh does not plan to increase production to compensate for current oil prices, which, in his opinion, remain low and do not imply an increase in investment in the industry. Instead, Saudi Arabia is in favor of extending the OPEC agreement, which ends at the end of this month. At the end of last week, quotes were also supported by Baker Hughes report on active oil rigs in the USA, the number of which for the reporting week dropped sharply from 800 to 789 units.
Support and resistance
On the daily chart, Bollinger Bands are steadily declining. The price range is narrowing from below, reflecting a quite sharp change of trend in the short term. MACD indicator is growing preserving a moderate buy signal (located above the signal line). Stochastic is growing almost vertically but is approaching its highs, which reflects the overbought instrument in the ultra-short term.
It is necessary to keep the existing long positions and open new ones in the short and/or ultra-short term until new trading signals from the indicators appear.
Resistance levels: 65.00, 66.06, 67.00, 67.70.
Support levels: 64.02, 63.08, 61.81, 60.51.


Trading tips
Long positions may be opened after the level of 65.00 is broken out with target at 67.70 or 68.63. Stop loss — 63.50 or 63.08.
Short positions may be opened after the rebound from 65.00 and the breakdown of 64.02 with targets at 60.51–60.00. Stop loss — 65.20.
Implementation time: 2-3 days.
Oil prices recovered significantly at the end of last week, departing from local lows of January 29, updated on June 5. The quotes are supported by positive comments by the Minister of Energy of Saudi Arabia, Khalid Al-Falih, who said that Riyadh does not plan to increase production to compensate for current oil prices, which, in his opinion, remain low and do not imply an increase in investment in the industry. Instead, Saudi Arabia is in favor of extending the OPEC agreement, which ends at the end of this month. At the end of last week, quotes were also supported by Baker Hughes report on active oil rigs in the USA, the number of which for the reporting week dropped sharply from 800 to 789 units.
Support and resistance
On the daily chart, Bollinger Bands are steadily declining. The price range is narrowing from below, reflecting a quite sharp change of trend in the short term. MACD indicator is growing preserving a moderate buy signal (located above the signal line). Stochastic is growing almost vertically but is approaching its highs, which reflects the overbought instrument in the ultra-short term.
It is necessary to keep the existing long positions and open new ones in the short and/or ultra-short term until new trading signals from the indicators appear.
Resistance levels: 65.00, 66.06, 67.00, 67.70.
Support levels: 64.02, 63.08, 61.81, 60.51.
Trading tips
Long positions may be opened after the level of 65.00 is broken out with target at 67.70 or 68.63. Stop loss — 63.50 or 63.08.
Short positions may be opened after the rebound from 65.00 and the breakdown of 64.02 with targets at 60.51–60.00. Stop loss — 65.20.
Implementation time: 2-3 days.


No comments:
Write comments