XAU/USD: technical analysis
11 February 2019, 10:18
| Scenario | |
|---|---|
| Timeframe | Weekly |
| Recommendation | BUY STOP |
| Entry Point | 1316.00 |
| Take Profit | 1323.00 |
| Stop Loss | 1312.00 |
| Key Levels | 1297.76, 1302.78, 1307.64, 1310.46, 1315.95, 1319.86, 1323.47, 1326.33 |
| Alternative scenario | |
|---|---|
| Recommendation | SELL STOP |
| Entry Point | 1310.00 |
| Take Profit | 1303.00 |
| Stop Loss | 1314.00 |
| Key Levels | 1297.76, 1302.78, 1307.64, 1310.46, 1315.95, 1319.86, 1323.47, 1326.33 |
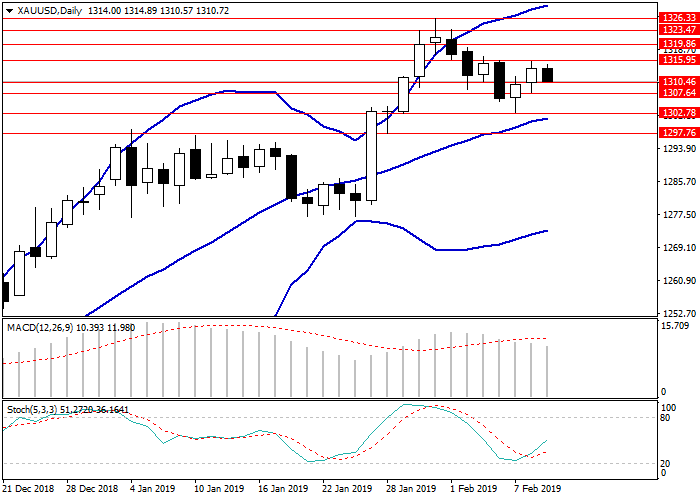
XAU/USD, D1
The D1 chart shows the correction of upward movement. The pair is trading between the upper and center lines of Bollinger Bands; the price range is widened. MACD histogram is in the positive area keeping a signal for the opening of long positions. Stochastic is in the neutral area, and the lines of the oscillator are reversing upwards.
XAU/USD, H4
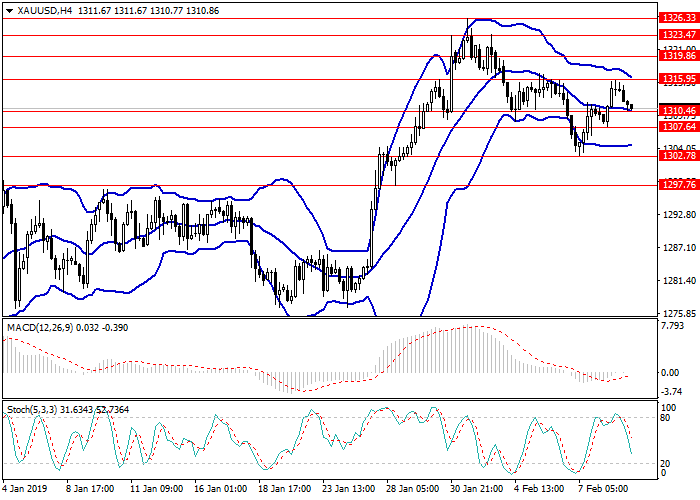
In the H4 chart, the instrument demonstrates lateral movement within the narrow channel formed by the boundaries of Bollinger Bands; the price range is narrowing. MACD histogram is at the zero level, its volumes are minimal; the signal line is reversing upwards. Stochastic is in the neutral zone, and the lines of the oscillator are directed downwards.
Key levels
Resistance levels: 1315.95, 1319.86, 1323.47, 1326.33.
Support levels: 1310.46, 1307.64, 1302.78, 1297.76.
Trading tips
Long positions may be opened from the level of 1316.00 with target at 1323.00 and stop loss at 1312.00.
Short positions may be opened from the level of 1310.00 with target at 1303.00. Stop loss — 1314.00.
Implementation time: 1-3 days.
The D1 chart shows the correction of upward movement. The pair is trading between the upper and center lines of Bollinger Bands; the price range is widened. MACD histogram is in the positive area keeping a signal for the opening of long positions. Stochastic is in the neutral area, and the lines of the oscillator are reversing upwards.
XAU/USD, H4
In the H4 chart, the instrument demonstrates lateral movement within the narrow channel formed by the boundaries of Bollinger Bands; the price range is narrowing. MACD histogram is at the zero level, its volumes are minimal; the signal line is reversing upwards. Stochastic is in the neutral zone, and the lines of the oscillator are directed downwards.
Key levels
Resistance levels: 1315.95, 1319.86, 1323.47, 1326.33.
Support levels: 1310.46, 1307.64, 1302.78, 1297.76.
Trading tips
Long positions may be opened from the level of 1316.00 with target at 1323.00 and stop loss at 1312.00.
Short positions may be opened from the level of 1310.00 with target at 1303.00. Stop loss — 1314.00.
Implementation time: 1-3 days.



No comments:
Write comments