USD/JPY: general analysis
08 February 2019, 10:11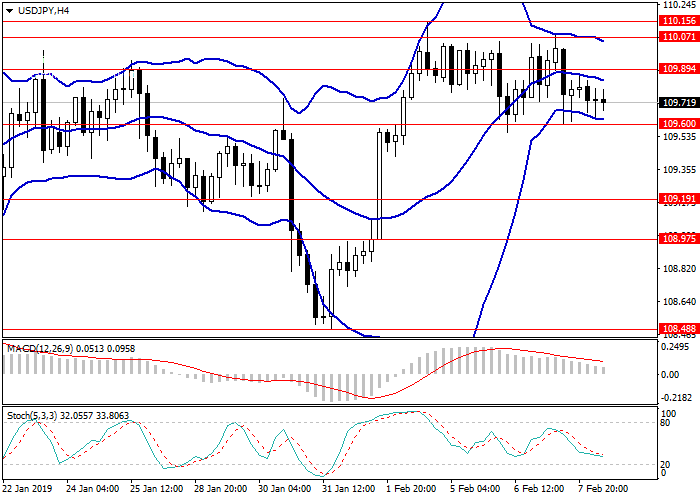
| Scenario | |
|---|---|
| Timeframe | Intraday |
| Recommendation | BUY STOP |
| Entry Point | 109.90 |
| Take Profit | 110.50 |
| Stop Loss | 109.60 |
| Key Levels | 108.48, 108.97, 109.19, 109.60, 109.89, 110.07, 110.15, 110.78 |
| Alternative scenario | |
|---|---|
| Recommendation | SELL STOP |
| Entry Point | 109.50 |
| Take Profit | 109.00 |
| Stop Loss | 109.80 |
| Key Levels | 108.48, 108.97, 109.19, 109.60, 109.89, 110.07, 110.15, 110.78 |
Current trend
Yesterday, USD was falling against JPY due to the release of poor statistics on the US labor market. The Initial Jobless Claims indicator amounted to 234K, exceeding the forecast by 13K applications.
During the Asian session on February 8, published statistics from Japan had no noticeable effect on the dynamics of the pair. Household spending in December rose by 0.1% YoY after a decline of 0.6% YoY last month. Analysts had expected a more active increase of 0.8% YoY. The wage rate indicator, which shows the average income of the employee before tax, rose by 1.8% YoY, which is 0.1% more than last month.
Support and resistance
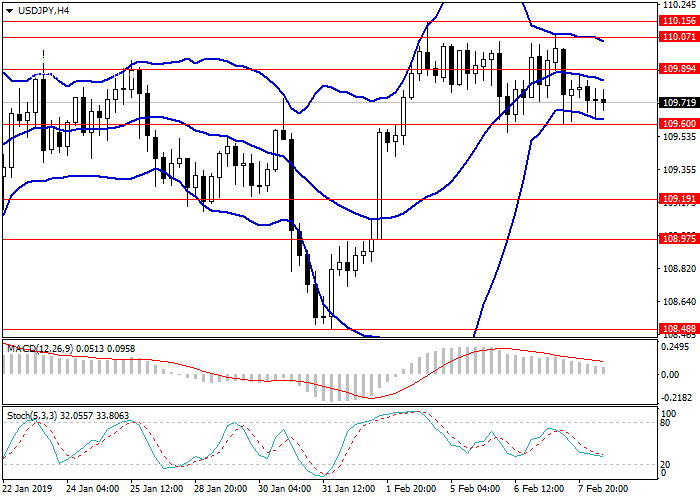
Today, as there is a lack of important economic releases, it is better to pay attention to the technical indicators. On the 4-hour chart, the instrument moves sideways within a narrow corridor formed by the lower border and the middle line of Bollinger bands, the price range narrows. MACD histogram is in the positive region, keeping the signal to open long positions.
Resistance levels: 109.89, 110.07, 110.15, 110.78.
Support levels: 109.60, 109.19, 108.97, 108.48.
Trading tips
Long positions can be opened from the level of 109.90 with the target at 110.50 and stop loss 109.60.
Short positions can be opened from the level of 109.50 with the target at 109.00 and stop loss 109.80.
Implementation period: 1–3 days.
Yesterday, USD was falling against JPY due to the release of poor statistics on the US labor market. The Initial Jobless Claims indicator amounted to 234K, exceeding the forecast by 13K applications.
During the Asian session on February 8, published statistics from Japan had no noticeable effect on the dynamics of the pair. Household spending in December rose by 0.1% YoY after a decline of 0.6% YoY last month. Analysts had expected a more active increase of 0.8% YoY. The wage rate indicator, which shows the average income of the employee before tax, rose by 1.8% YoY, which is 0.1% more than last month.
Support and resistance
Today, as there is a lack of important economic releases, it is better to pay attention to the technical indicators. On the 4-hour chart, the instrument moves sideways within a narrow corridor formed by the lower border and the middle line of Bollinger bands, the price range narrows. MACD histogram is in the positive region, keeping the signal to open long positions.
Resistance levels: 109.89, 110.07, 110.15, 110.78.
Support levels: 109.60, 109.19, 108.97, 108.48.
Trading tips
Long positions can be opened from the level of 109.90 with the target at 110.50 and stop loss 109.60.
Short positions can be opened from the level of 109.50 with the target at 109.00 and stop loss 109.80.
Implementation period: 1–3 days.



No comments:
Write comments