
USD/CHF: wave analysis
05 February 2019, 08:42
| Scenario | |
|---|---|
| Timeframe | Weekly |
| Recommendation | SELL |
| Entry Point | 0.9983 |
| Take Profit | 0.9888, 0.9854 |
| Stop Loss | 1.0006 |
| Key Levels | 0.9854, 0.9888, 1.0006, 1.0073, 1.0126 |
| Alternative scenario | |
|---|---|
| Recommendation | BUY STOP |
| Entry Point | 1.0010 |
| Take Profit | 1.0073, 1.0126 |
| Stop Loss | 0.9975 |
| Key Levels | 0.9854, 0.9888, 1.0006, 1.0073, 1.0126 |
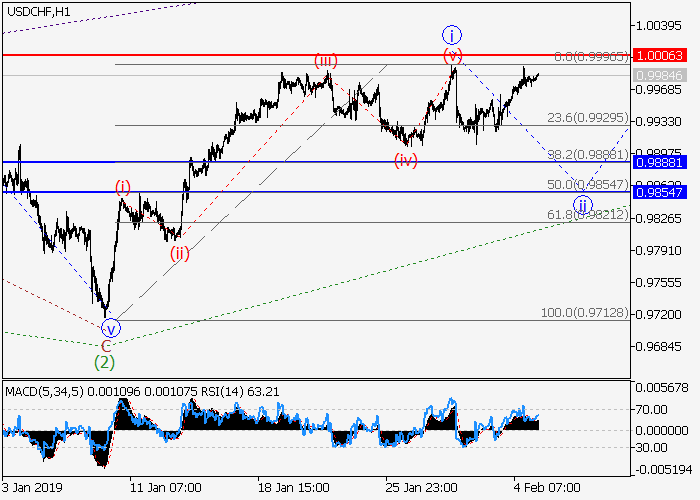
The pair can decrease within the correction.
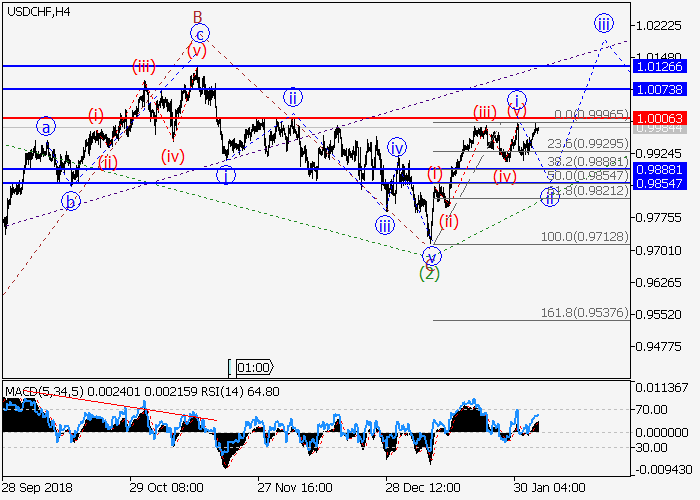
On the 4-hour chart, a downward correction of the higher level developed as the wave (2), within which the wave C of (2) formed. Now the development of the third wave (3) has begun, within which the first wave of the lower level i of 1 of (3) has formed, and the local correction ii of 1 is developing. If the assumption is correct, the pair will fall to the levels of 0.9888–0.9854. In this scenario, critical stop loss level is 1.0006.
Main scenario
Short positions will become relevant below the level of 1.0006 with the targets at 0.9888–0.9854. Implementation period: 5–7 days.
Alternative scenario
The breakout and the consolidation of the price above the level of 1.0006 will let the pair grow to the levels of 1.0073–1.0126.


No comments:
Write comments