USD/CAD: general review
11 February 2019, 13:23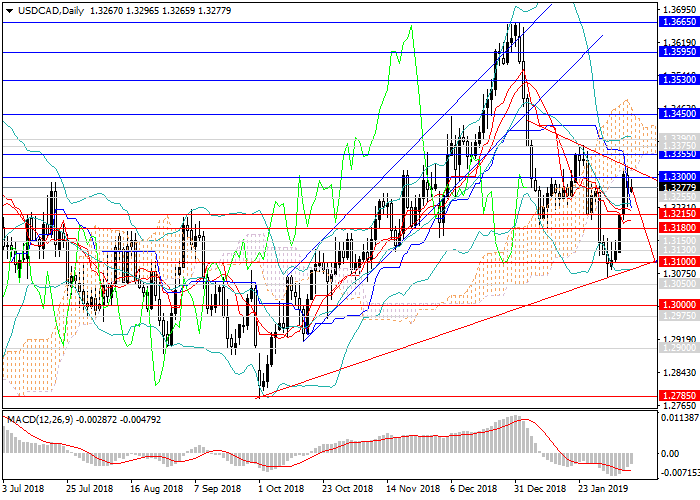
| Scenario | |
|---|---|
| Timeframe | Weekly |
| Recommendation | SELL |
| Entry Point | 1.3277 |
| Take Profit | 1.3100 |
| Stop Loss | 1.3330 |
| Key Levels | 1.2900, 1.2975, 1.3000, 1.3100, 1.3130, 1.3150, 1.3180, 1.3215, 1.3300, 1.3355, 1.3375, 1.3390, 1.3450, 1.3530, 1.3595, 1.3665 |
Current trend
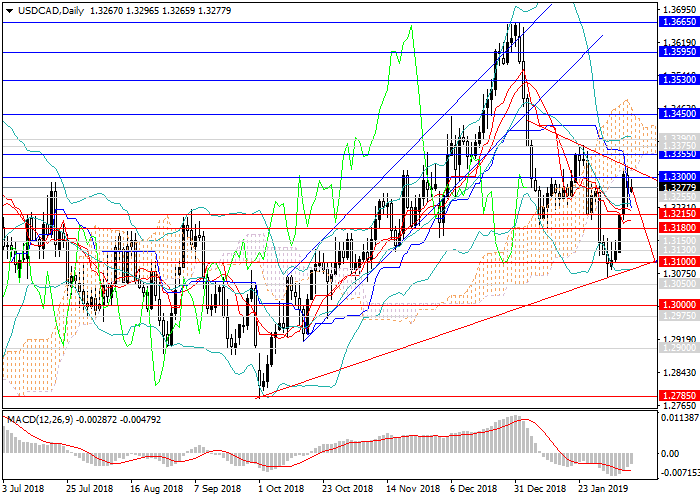
In early January, USD fell sharply against the Canadian dollar, losing more than 450 points in the first 10 days and reaching the level of 1.3180.
Then the pair slightly adjusted upwards, after which the next downward wave was formed. Currently, the instrument is moving to a wide lateral consolidation: at the end of January and early February, the pair first dropped by 250 points, and then rose by the same 250 points. The main catalyst for this is the rapid growth of USD amid accelerating demand and the subsequent fall on weak labor market data and production orders.
Support and resistance
This week, one should focus on inflation data, retail sales, industrial production, and major indices. The main indicator for the US dollar is inflationary pressure, the growth or decrease of which directly affects the decision on interest rates and changes in monetary policy. A new downward wave with the target at 1.3100 is expected, after which the pair can recover to 1.3215, 1.3255.
Indicators confirm the possible transition to lateral consolidation: MACD indicates a decline in the volume of short positions, and Bollinger Bands are arranged horizontally.
Support levels: 1.3215, 1.3180, 1.3150, 1.3130, 1.3100, 1.3000, 1.2975, 1.2900.
Resistance levels: 1.3300, 1.3355, 1.3375, 1.3390, 1.3450, 1.3530, 1.3595, 1.3665.
Trading tips
Short positions may be opened from the current level with the target at 1.3100 and stop loss at 1.3330.
In early January, USD fell sharply against the Canadian dollar, losing more than 450 points in the first 10 days and reaching the level of 1.3180.
Then the pair slightly adjusted upwards, after which the next downward wave was formed. Currently, the instrument is moving to a wide lateral consolidation: at the end of January and early February, the pair first dropped by 250 points, and then rose by the same 250 points. The main catalyst for this is the rapid growth of USD amid accelerating demand and the subsequent fall on weak labor market data and production orders.
Support and resistance
This week, one should focus on inflation data, retail sales, industrial production, and major indices. The main indicator for the US dollar is inflationary pressure, the growth or decrease of which directly affects the decision on interest rates and changes in monetary policy. A new downward wave with the target at 1.3100 is expected, after which the pair can recover to 1.3215, 1.3255.
Indicators confirm the possible transition to lateral consolidation: MACD indicates a decline in the volume of short positions, and Bollinger Bands are arranged horizontally.
Support levels: 1.3215, 1.3180, 1.3150, 1.3130, 1.3100, 1.3000, 1.2975, 1.2900.
Resistance levels: 1.3300, 1.3355, 1.3375, 1.3390, 1.3450, 1.3530, 1.3595, 1.3665.
Trading tips
Short positions may be opened from the current level with the target at 1.3100 and stop loss at 1.3330.



No comments:
Write comments