EUR/GBP: Ichimoku clouds
07 February 2019, 20:29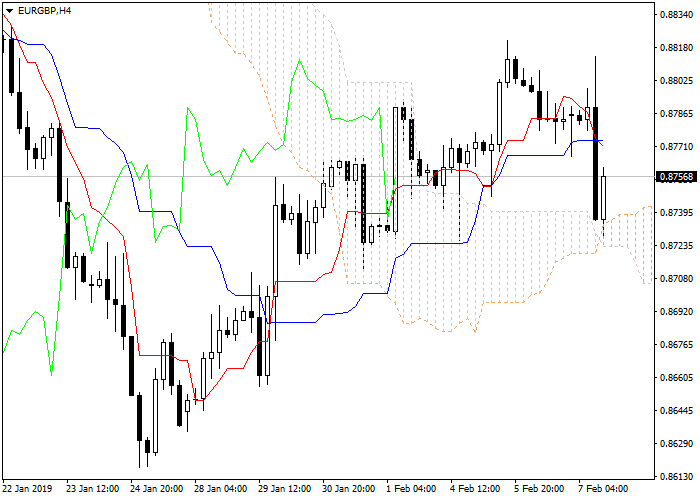
| Scenario | |
|---|---|
| Timeframe | Weekly |
| Recommendation | SELL |
| Entry Point | 0.8755 |
| Take Profit | 0.8635 |
| Stop Loss | 0.8850 |
| Key Levels | 0.8725, 0.8740, 0.8770 |
Let's look at the four-hour chart. Tenkan-sen line is below Kijun-sen, the lines are horizontal . Confirmative line Chikou Span is crossing the price chart from above, current cloud is ascending. The instrument has broken down Tenkan-sen and Kijun-sen lines. The closest support level is the upper border of the cloud (0.8740). The closest resistance level is Tenkan-sen line (0.8770).
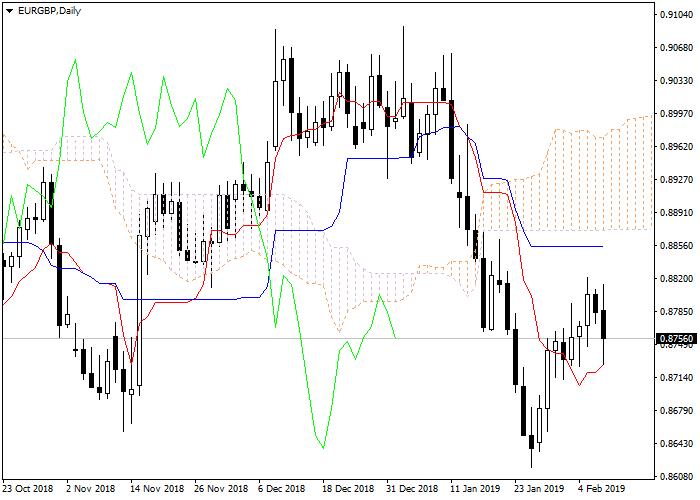
On the daily chart Tenkan-sen line is below Kijun-sen, the red line is directed upwards, while the blue one remains horizontal. Confirmative line Chikou Span is below the price chart, current cloud is descending. The instrument is trading between Tenkan-sen and Kijun-sen lines. The closest support level is Tenkan-sen line (0.8725). The closest resistance level is Kijun-sen line (0.8850).
On the four-hour chart we've got a signal of trend reversal from ascending to descending. On the daily chart we can see a correction of the downward movement. It is recommended to open short positions at current price with Take Profit at the level of previous minimum of Chikou Span line (0.8635) and Stop Loss at the level of Kijun-sen line (0.8850).



No comments:
Write comments