
AUD/USD: Australian dollar is in correction
19 February 2019, 08:49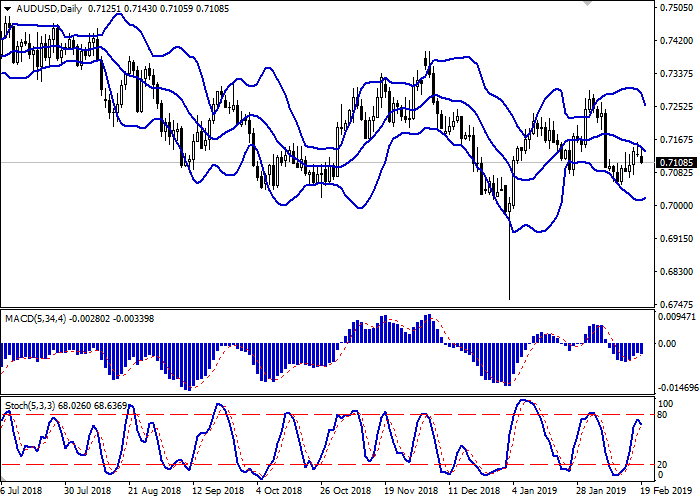
| Scenario | |
|---|---|
| Timeframe | Intraday |
| Recommendation | BUY STOP |
| Entry Point | 0.7120 |
| Take Profit | 0.7159, 0.7179, 0.7200 |
| Stop Loss | 0.7090, 0.7080 |
| Key Levels | 0.7052, 0.7075, 0.7090, 0.7116, 0.7142, 0.7159, 0.7179, 0.7200 |
| Alternative scenario | |
|---|---|
| Recommendation | SELL STOP |
| Entry Point | 0.7085 |
| Take Profit | 0.7052, 0.7030 |
| Stop Loss | 0.7100 |
| Key Levels | 0.7052, 0.7075, 0.7090, 0.7116, 0.7142, 0.7159, 0.7179, 0.7200 |
Current trend
AUD is trading within a downward direction against USD, retreating as the market becomes saturated with the news. USD is in demand due to a noticeable improvement in the prospects for the US-China trade negotiations, which inspire hope that the agreement will still be reached before the deadline on March 1.
The minutes of the February 5 meeting of the Reserve Bank of Australia published today did not support the instrument. The regulator noted a noticeable improvement in the labor market but also pointed to a sharp increase in external risks in the past few months. At the end of 2019, the RBA expects economic growth of about 3%, after which GDP growth may slow down to an average of 2.75% by mid-late 2020.
Support and resistance
On the daily chart, Bollinger bands decrease. The price range narrows, indicating the mixed nature of trading in recent weeks. MACD tries to reverse downwards and form a new sell signal (the histogram should be located below the signal line). Stochastic reversed downwards near its highs.
The current readings of technical indicators reflect growing prospects for the formation of a corrective downtrend in the short and/or ultra-short term. However, to open new short positions, it is better to wait for more confident trading signals to appear.
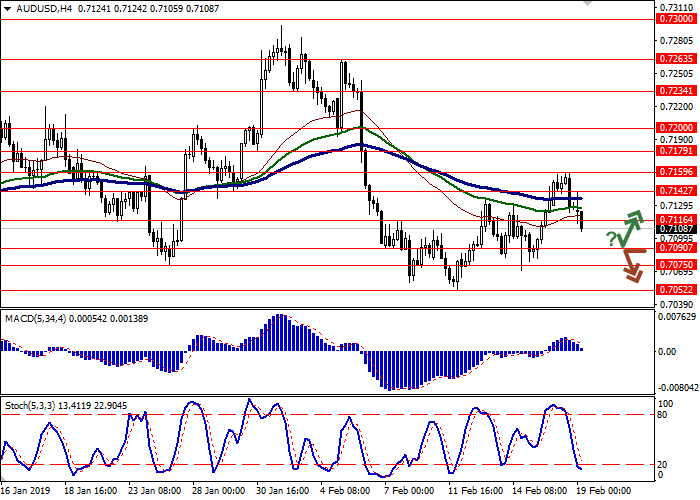
Resistance levels: 0.7142, 0.7159, 0.7179, 0.7200.
Support levels: 0.7116, 0.7090, 0.7075, 0.7052.

Trading tips
Long positions can be opened after a rebound from 0.7090 and a breakout of 0.7116 with the targets at 0.7159 or 0.7179–0.7200. Stop loss is 0.7090–0.7080. Implementation period: 2–3 days.
Short positions can be opened after the breakdown of 0.7090 with the targets at 0.7052–0.7030. Stop loss is 0.7100. Implementation period: 1–2 days.
AUD is trading within a downward direction against USD, retreating as the market becomes saturated with the news. USD is in demand due to a noticeable improvement in the prospects for the US-China trade negotiations, which inspire hope that the agreement will still be reached before the deadline on March 1.
The minutes of the February 5 meeting of the Reserve Bank of Australia published today did not support the instrument. The regulator noted a noticeable improvement in the labor market but also pointed to a sharp increase in external risks in the past few months. At the end of 2019, the RBA expects economic growth of about 3%, after which GDP growth may slow down to an average of 2.75% by mid-late 2020.
Support and resistance
On the daily chart, Bollinger bands decrease. The price range narrows, indicating the mixed nature of trading in recent weeks. MACD tries to reverse downwards and form a new sell signal (the histogram should be located below the signal line). Stochastic reversed downwards near its highs.
The current readings of technical indicators reflect growing prospects for the formation of a corrective downtrend in the short and/or ultra-short term. However, to open new short positions, it is better to wait for more confident trading signals to appear.
Resistance levels: 0.7142, 0.7159, 0.7179, 0.7200.
Support levels: 0.7116, 0.7090, 0.7075, 0.7052.
Trading tips
Long positions can be opened after a rebound from 0.7090 and a breakout of 0.7116 with the targets at 0.7159 or 0.7179–0.7200. Stop loss is 0.7090–0.7080. Implementation period: 2–3 days.
Short positions can be opened after the breakdown of 0.7090 with the targets at 0.7052–0.7030. Stop loss is 0.7100. Implementation period: 1–2 days.


No comments:
Write comments