
XAU/USD: technical analysis
10 January 2019, 10:19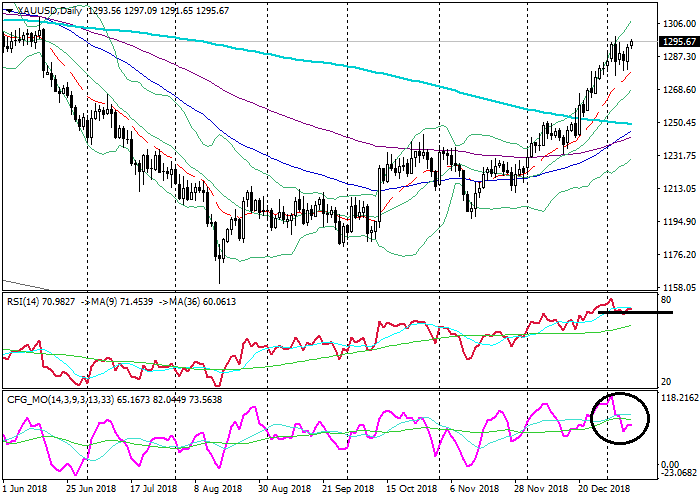
| Scenario | |
|---|---|
| Timeframe | Weekly |
| Recommendation | SELL STOP |
| Entry Point | 1277.0 |
| Take Profit | 1265.0, 1250.0 |
| Stop Loss | 1285.0 |
| Key Levels | 1250.0, 1265.0, 1277.0, 1302.0, 1315.0, 1325.0 |
| Alternative scenario | |
|---|---|
| Recommendation | BUY STOP |
| Entry Point | 1302.0 |
| Take Profit | 1315.0, 1325.0 |
| Stop Loss | 1294.0 |
| Key Levels | 1250.0, 1265.0, 1277.0, 1302.0, 1315.0, 1325.0 |
XAU/USD, D1
On the daily chart, the instrument is trading in the upper Bollinger band. The price remains above its moving averages that start turning up. The RSI is testing from above the border of the overbought zone. The Composite is falling, having broken down its longer MA.

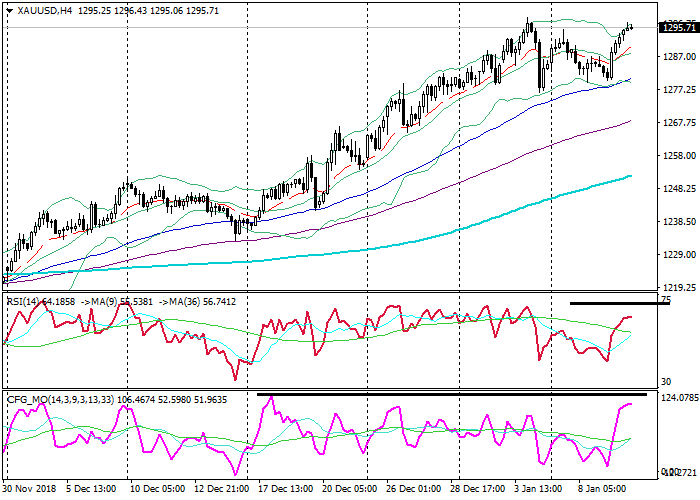
XAU/USD, H4
On the 4-hour chart, the instrument is trading on the upper line of the Bollinger Bands. The price remains above its moving averages that are directed up. The RSI is about to test the border of the overbought zone. The Composite is approaching its strong resistance.
Key levels
Support levels: 1277.0 (local lows), 1265.0 (November 2017 lows), 1250.0 (local lows).
Resistance levels: 1302.0 (local highs), 1315.0 (local highs), 1325.0 (May 2018 highs).
Trading tips
The price is about to test its strong resistance near 1302.0. There is a chance of a downward correction.
Short positions can be opened from the level of 1277.0 with targets at 1265.0, 1250.0 and stop-loss at 1285.0. Validity – 3-5 days.
Long positions can be opened from the level of 1302.0 with targets at 1315.0, 1325.0 and stop-loss at 1294.0. Validity – 3-5 days.
On the daily chart, the instrument is trading in the upper Bollinger band. The price remains above its moving averages that start turning up. The RSI is testing from above the border of the overbought zone. The Composite is falling, having broken down its longer MA.
XAU/USD, H4
On the 4-hour chart, the instrument is trading on the upper line of the Bollinger Bands. The price remains above its moving averages that are directed up. The RSI is about to test the border of the overbought zone. The Composite is approaching its strong resistance.
Key levels
Support levels: 1277.0 (local lows), 1265.0 (November 2017 lows), 1250.0 (local lows).
Resistance levels: 1302.0 (local highs), 1315.0 (local highs), 1325.0 (May 2018 highs).
Trading tips
The price is about to test its strong resistance near 1302.0. There is a chance of a downward correction.
Short positions can be opened from the level of 1277.0 with targets at 1265.0, 1250.0 and stop-loss at 1285.0. Validity – 3-5 days.
Long positions can be opened from the level of 1302.0 with targets at 1315.0, 1325.0 and stop-loss at 1294.0. Validity – 3-5 days.


No comments:
Write comments