
XAU/USD: gold prices are rising
30 January 2019, 09:08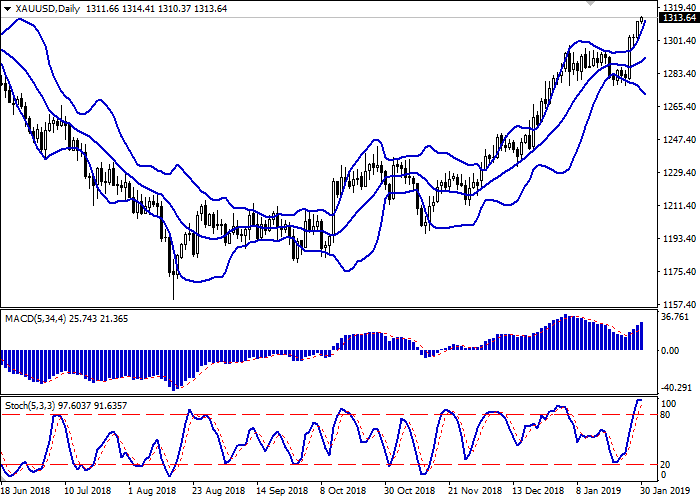
| Scenario | |
|---|---|
| Timeframe | Intraday |
| Recommendation | BUY STOP |
| Entry Point | 1314.50, 1317.20 |
| Take Profit | 1320.87, 1324.00 |
| Stop Loss | 1310.00, 1308.93 |
| Key Levels | 1292.69, 1298.32, 1304.21, 1308.93, 1314.41, 1317.17, 1320.87 |
| Alternative scenario | |
|---|---|
| Recommendation | SELL STOP |
| Entry Point | 1308.90 |
| Take Profit | 1298.32 |
| Stop Loss | 1314.41 |
| Key Levels | 1292.69, 1298.32, 1304.21, 1308.93, 1314.41, 1317.17, 1320.87 |
Current trend
Gold prices continue to rise steadily, renewing highs since May 2018. The instrument is supported by weak USD and soft Fed’s position, which implies a pause in the monetary tightening.
Investors are focused on new the complication of US-China relations before the trade negotiations on January 30-31. On Monday, the US Department of Justice officially accused the Chinese company Huawei of two dozen crimes; including violating the sanctions regime against Iran and stealing technology from the American company T-Mobile. Acting US Attorney General Matthew Whitaker said that the US would seek extradition of Huawei Finance Director Meng Wanzhou from Canada. Investors fear that the situation could undermine the prospects for a trade deal. China is unlikely to forgive it and may respond by tightening negotiating positions or creating problems for American companies operating in the PRC, for example, Apple.
Support and resistance
On the daily chart, Bollinger bands grow moderately. The price range actively expands but not as fast as the "bullish" develops. MACD grows, keeping a strong buy signal (the histogram is above the signal line). Stochastic reached its highs and reversed horizontally, reflecting that the instrument is strongly overbought the super short term.
The current indicators’ readings do not contradict the further development of the “bullish” trend in the short term. Nevertheless, the correctional dynamics can develop at the end of the week.
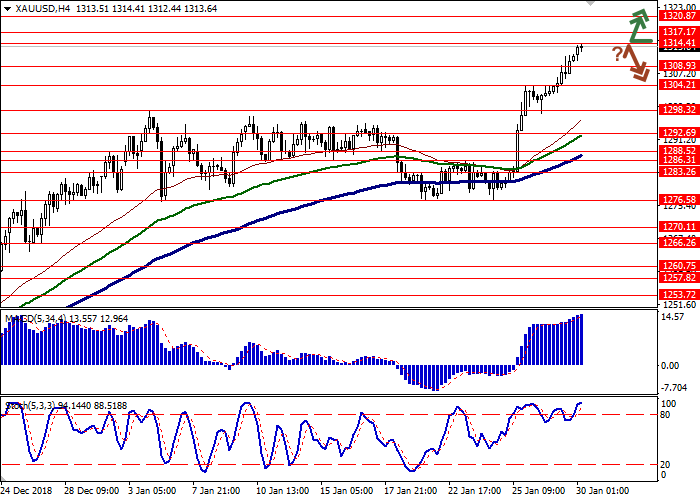
Resistance levels: 1314.41, 1317.17, 1320.87.
Support levels: 1308.93, 1304.21, 1298.32, 1292.69.

Trading tips
Long positions can be opened after the breakout of 1314.41 or 1317.17 with the target at 1320.87 or 1324.00. Stop loss is 1310.00 or 1308.93.
Short positions can be opened after the rebound from 1314.41 and the breakdown of 1308.93 with the target at 1298.32. Stop loss is 1314.41.
Implementation period: 2–3 days.
Gold prices continue to rise steadily, renewing highs since May 2018. The instrument is supported by weak USD and soft Fed’s position, which implies a pause in the monetary tightening.
Investors are focused on new the complication of US-China relations before the trade negotiations on January 30-31. On Monday, the US Department of Justice officially accused the Chinese company Huawei of two dozen crimes; including violating the sanctions regime against Iran and stealing technology from the American company T-Mobile. Acting US Attorney General Matthew Whitaker said that the US would seek extradition of Huawei Finance Director Meng Wanzhou from Canada. Investors fear that the situation could undermine the prospects for a trade deal. China is unlikely to forgive it and may respond by tightening negotiating positions or creating problems for American companies operating in the PRC, for example, Apple.
Support and resistance
On the daily chart, Bollinger bands grow moderately. The price range actively expands but not as fast as the "bullish" develops. MACD grows, keeping a strong buy signal (the histogram is above the signal line). Stochastic reached its highs and reversed horizontally, reflecting that the instrument is strongly overbought the super short term.
The current indicators’ readings do not contradict the further development of the “bullish” trend in the short term. Nevertheless, the correctional dynamics can develop at the end of the week.
Resistance levels: 1314.41, 1317.17, 1320.87.
Support levels: 1308.93, 1304.21, 1298.32, 1292.69.
Trading tips
Long positions can be opened after the breakout of 1314.41 or 1317.17 with the target at 1320.87 or 1324.00. Stop loss is 1310.00 or 1308.93.
Short positions can be opened after the rebound from 1314.41 and the breakdown of 1308.93 with the target at 1298.32. Stop loss is 1314.41.
Implementation period: 2–3 days.


No comments:
Write comments